

Reading the COGS Reports
Contents7 sections
Cost of goods is the number that decides whether a busy month was a profitable one. Boost Back Office gives you three views of it, and each answers a different question.
Total COGS %: are we where we want to be?
Go to Reports > Location Reports > Total COGS %, or the business-wide version under Business Reports. Set your date range and your COGS Goal.
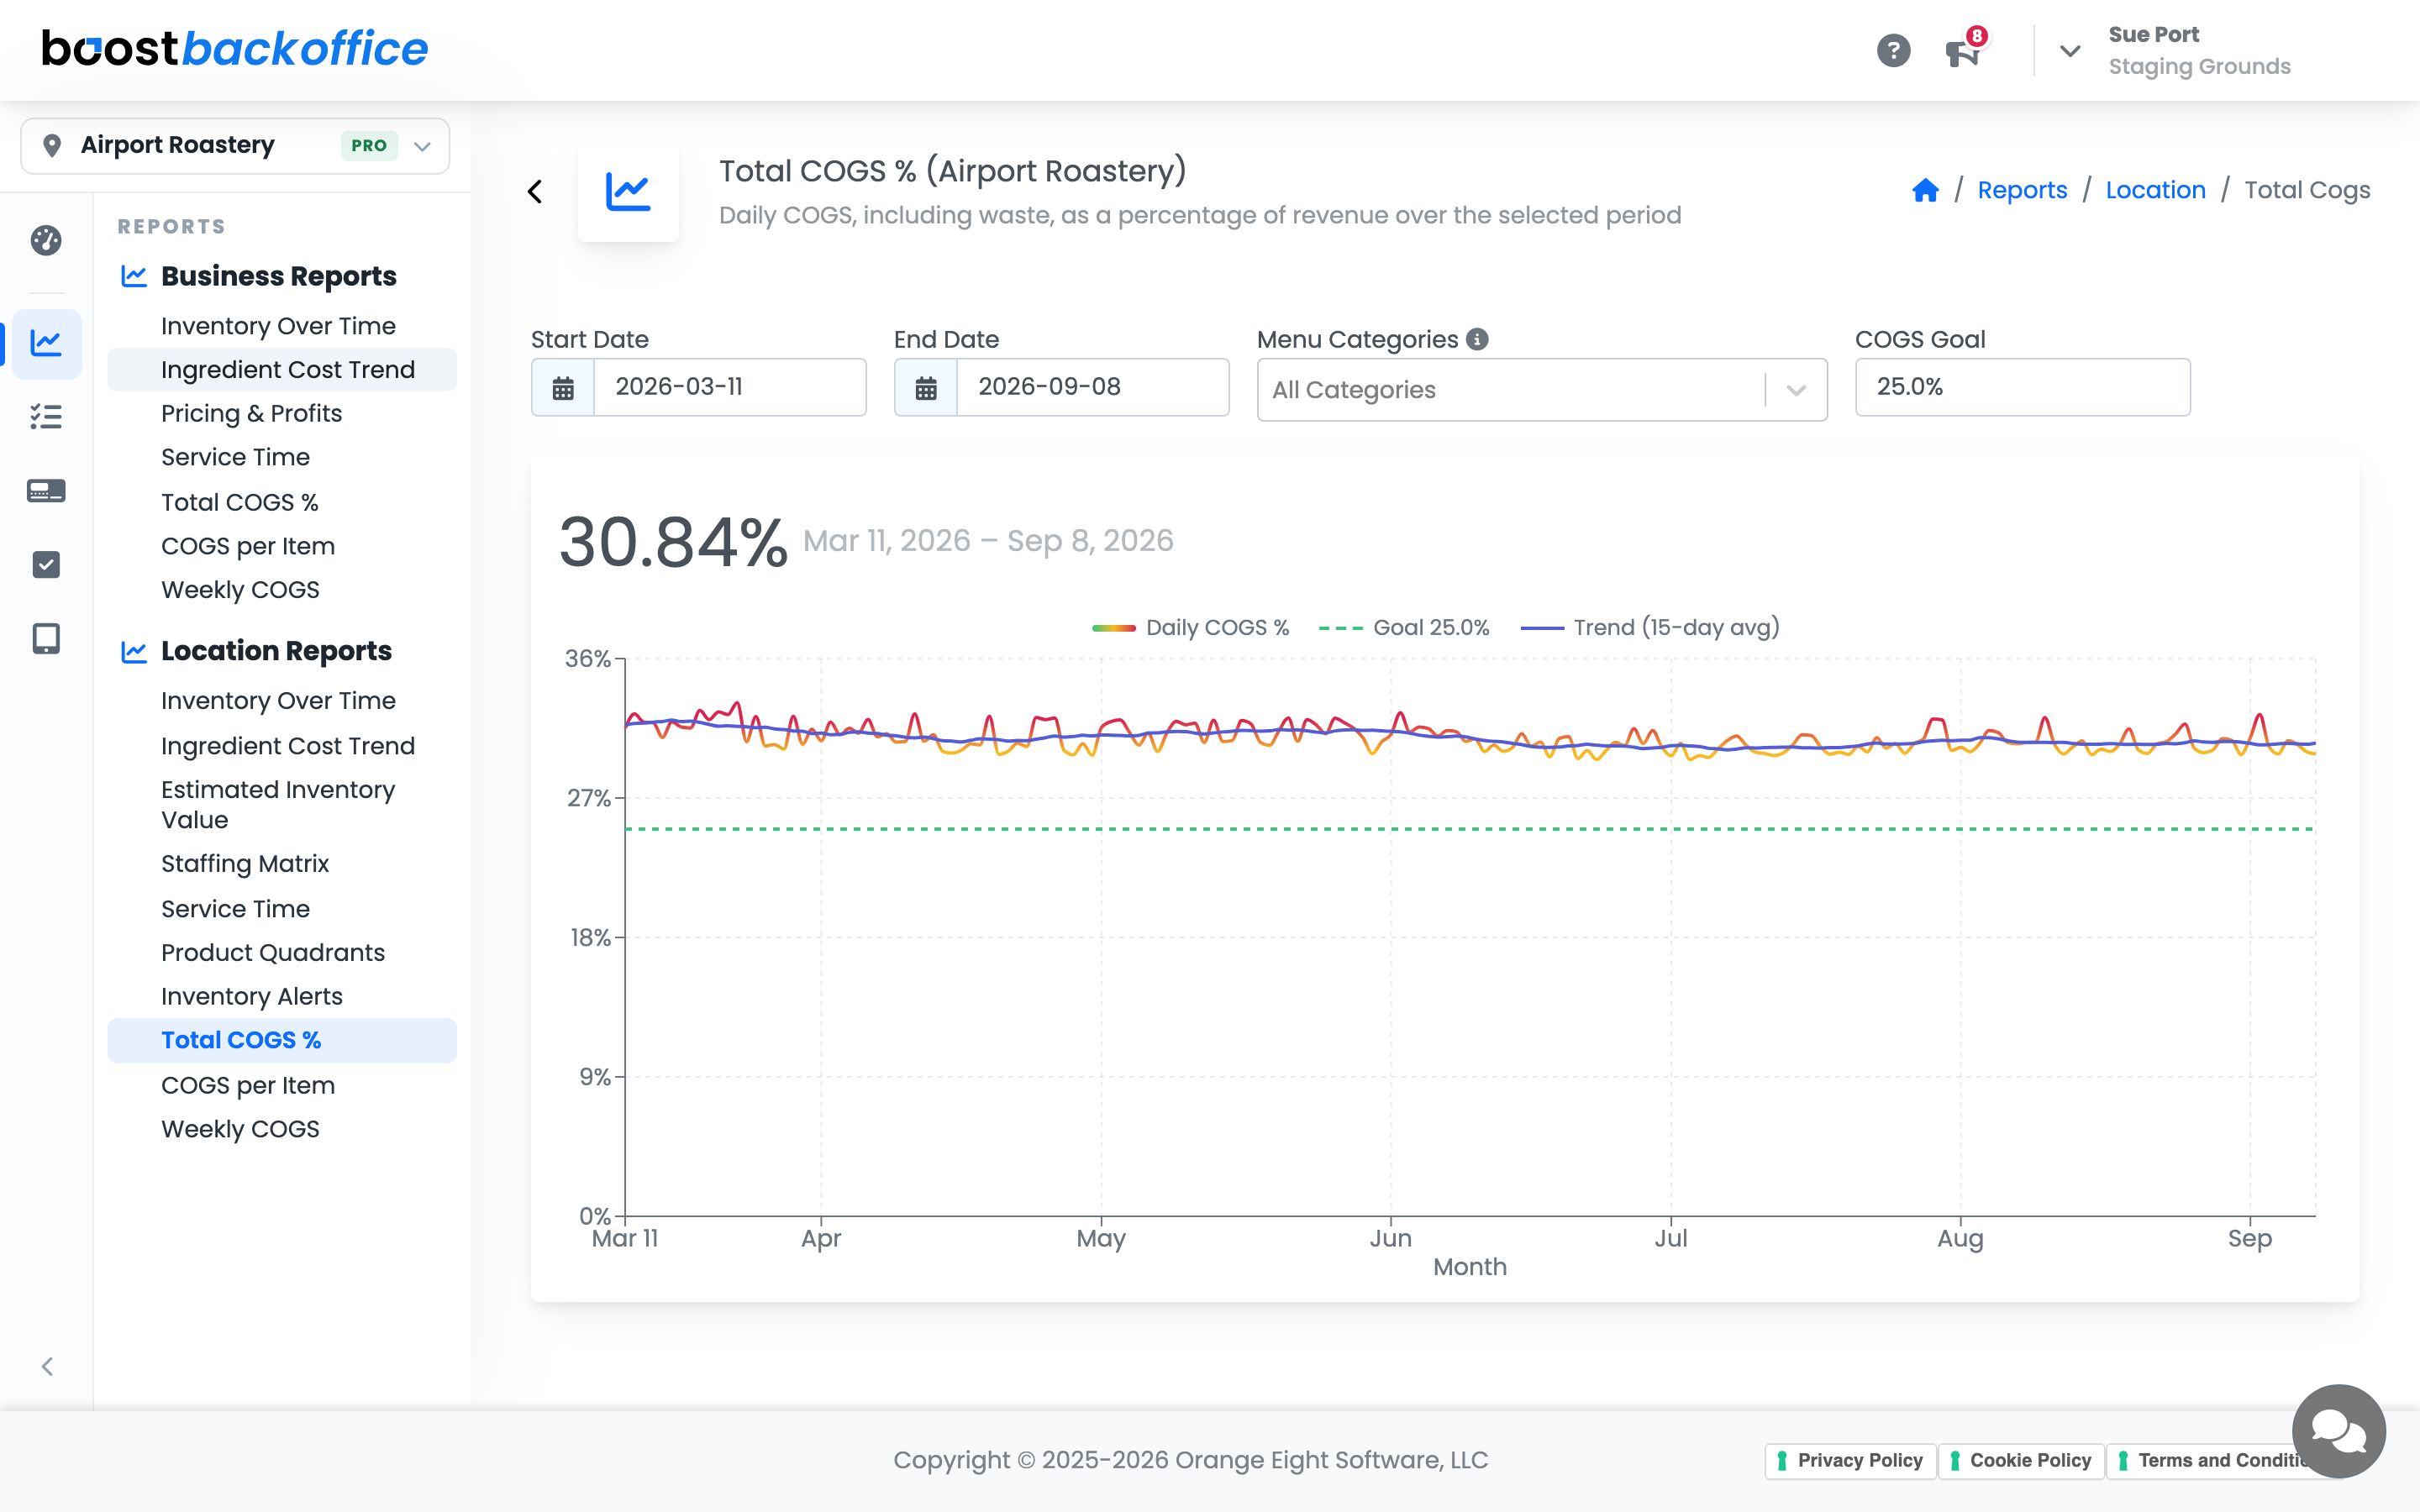
The headline is your COGS for the period. The chart carries three things:
- Daily COGS %, the day-by-day line, which is noisy by nature.
- Goal, the dotted line you set. Everything is read against it.
- Trend (15-day avg), the line that actually tells you the direction.
Watch the trend, not the daily line. One heavy delivery day is not a problem; three weeks of the trend drifting above the goal is.
Note
With no category selected, these figures include waste as a percentage of revenue. That is deliberate: product you threw away cost you exactly as much as product you sold. Pick a category and waste steps out of the maths — see Narrowing it to one part of the menu below.
Narrowing it to one part of the menu
The headline covers everything you sell, which tells you that the number moved without telling you what moved it. Open Menu Categories and choose one category, or several, and the headline, the chart and the day breakdown all narrow to just those items.
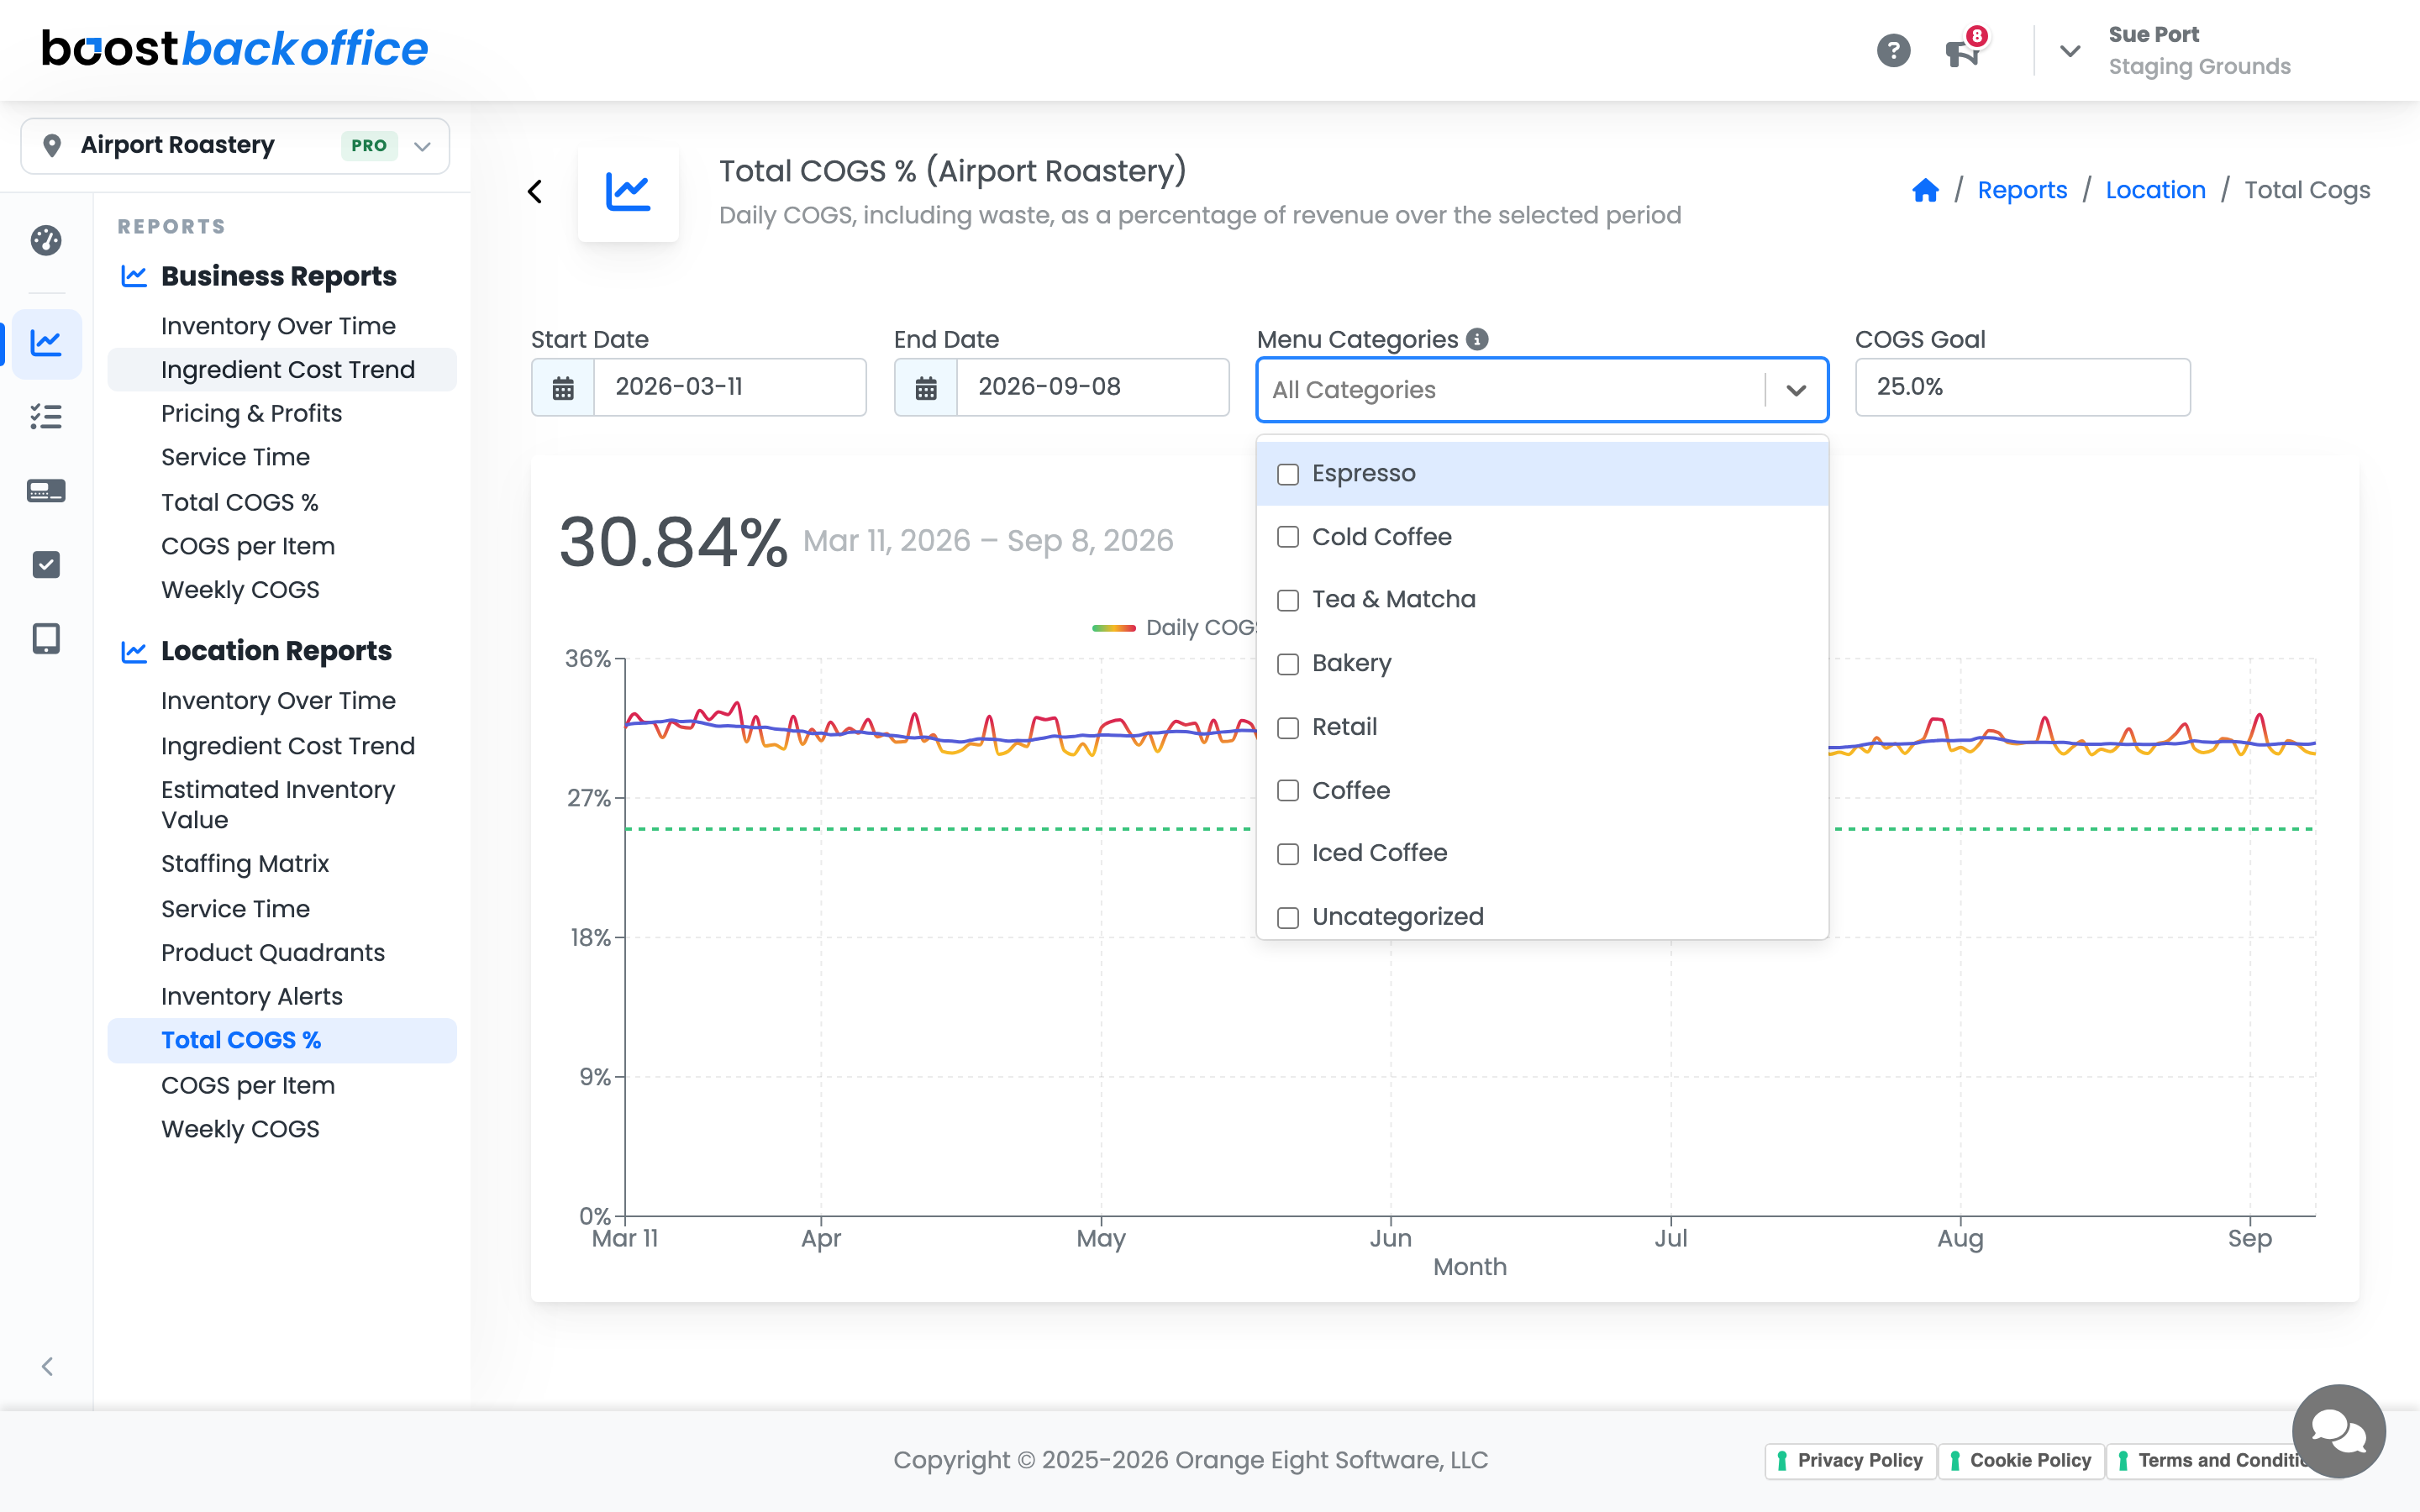
Leave the picker alone and nothing changes: you get the same whole-shop number you had before.
A category figure is a sales-side figure, and it is not the same measurement as the headline:
- Waste steps out. Product you threw away does not belong to any one drink, so it cannot be charged to a category. The card under the percentage names the exact dollars it set aside.
- Order-level discounts and refunds step out, because those land on the whole order rather than on a line.
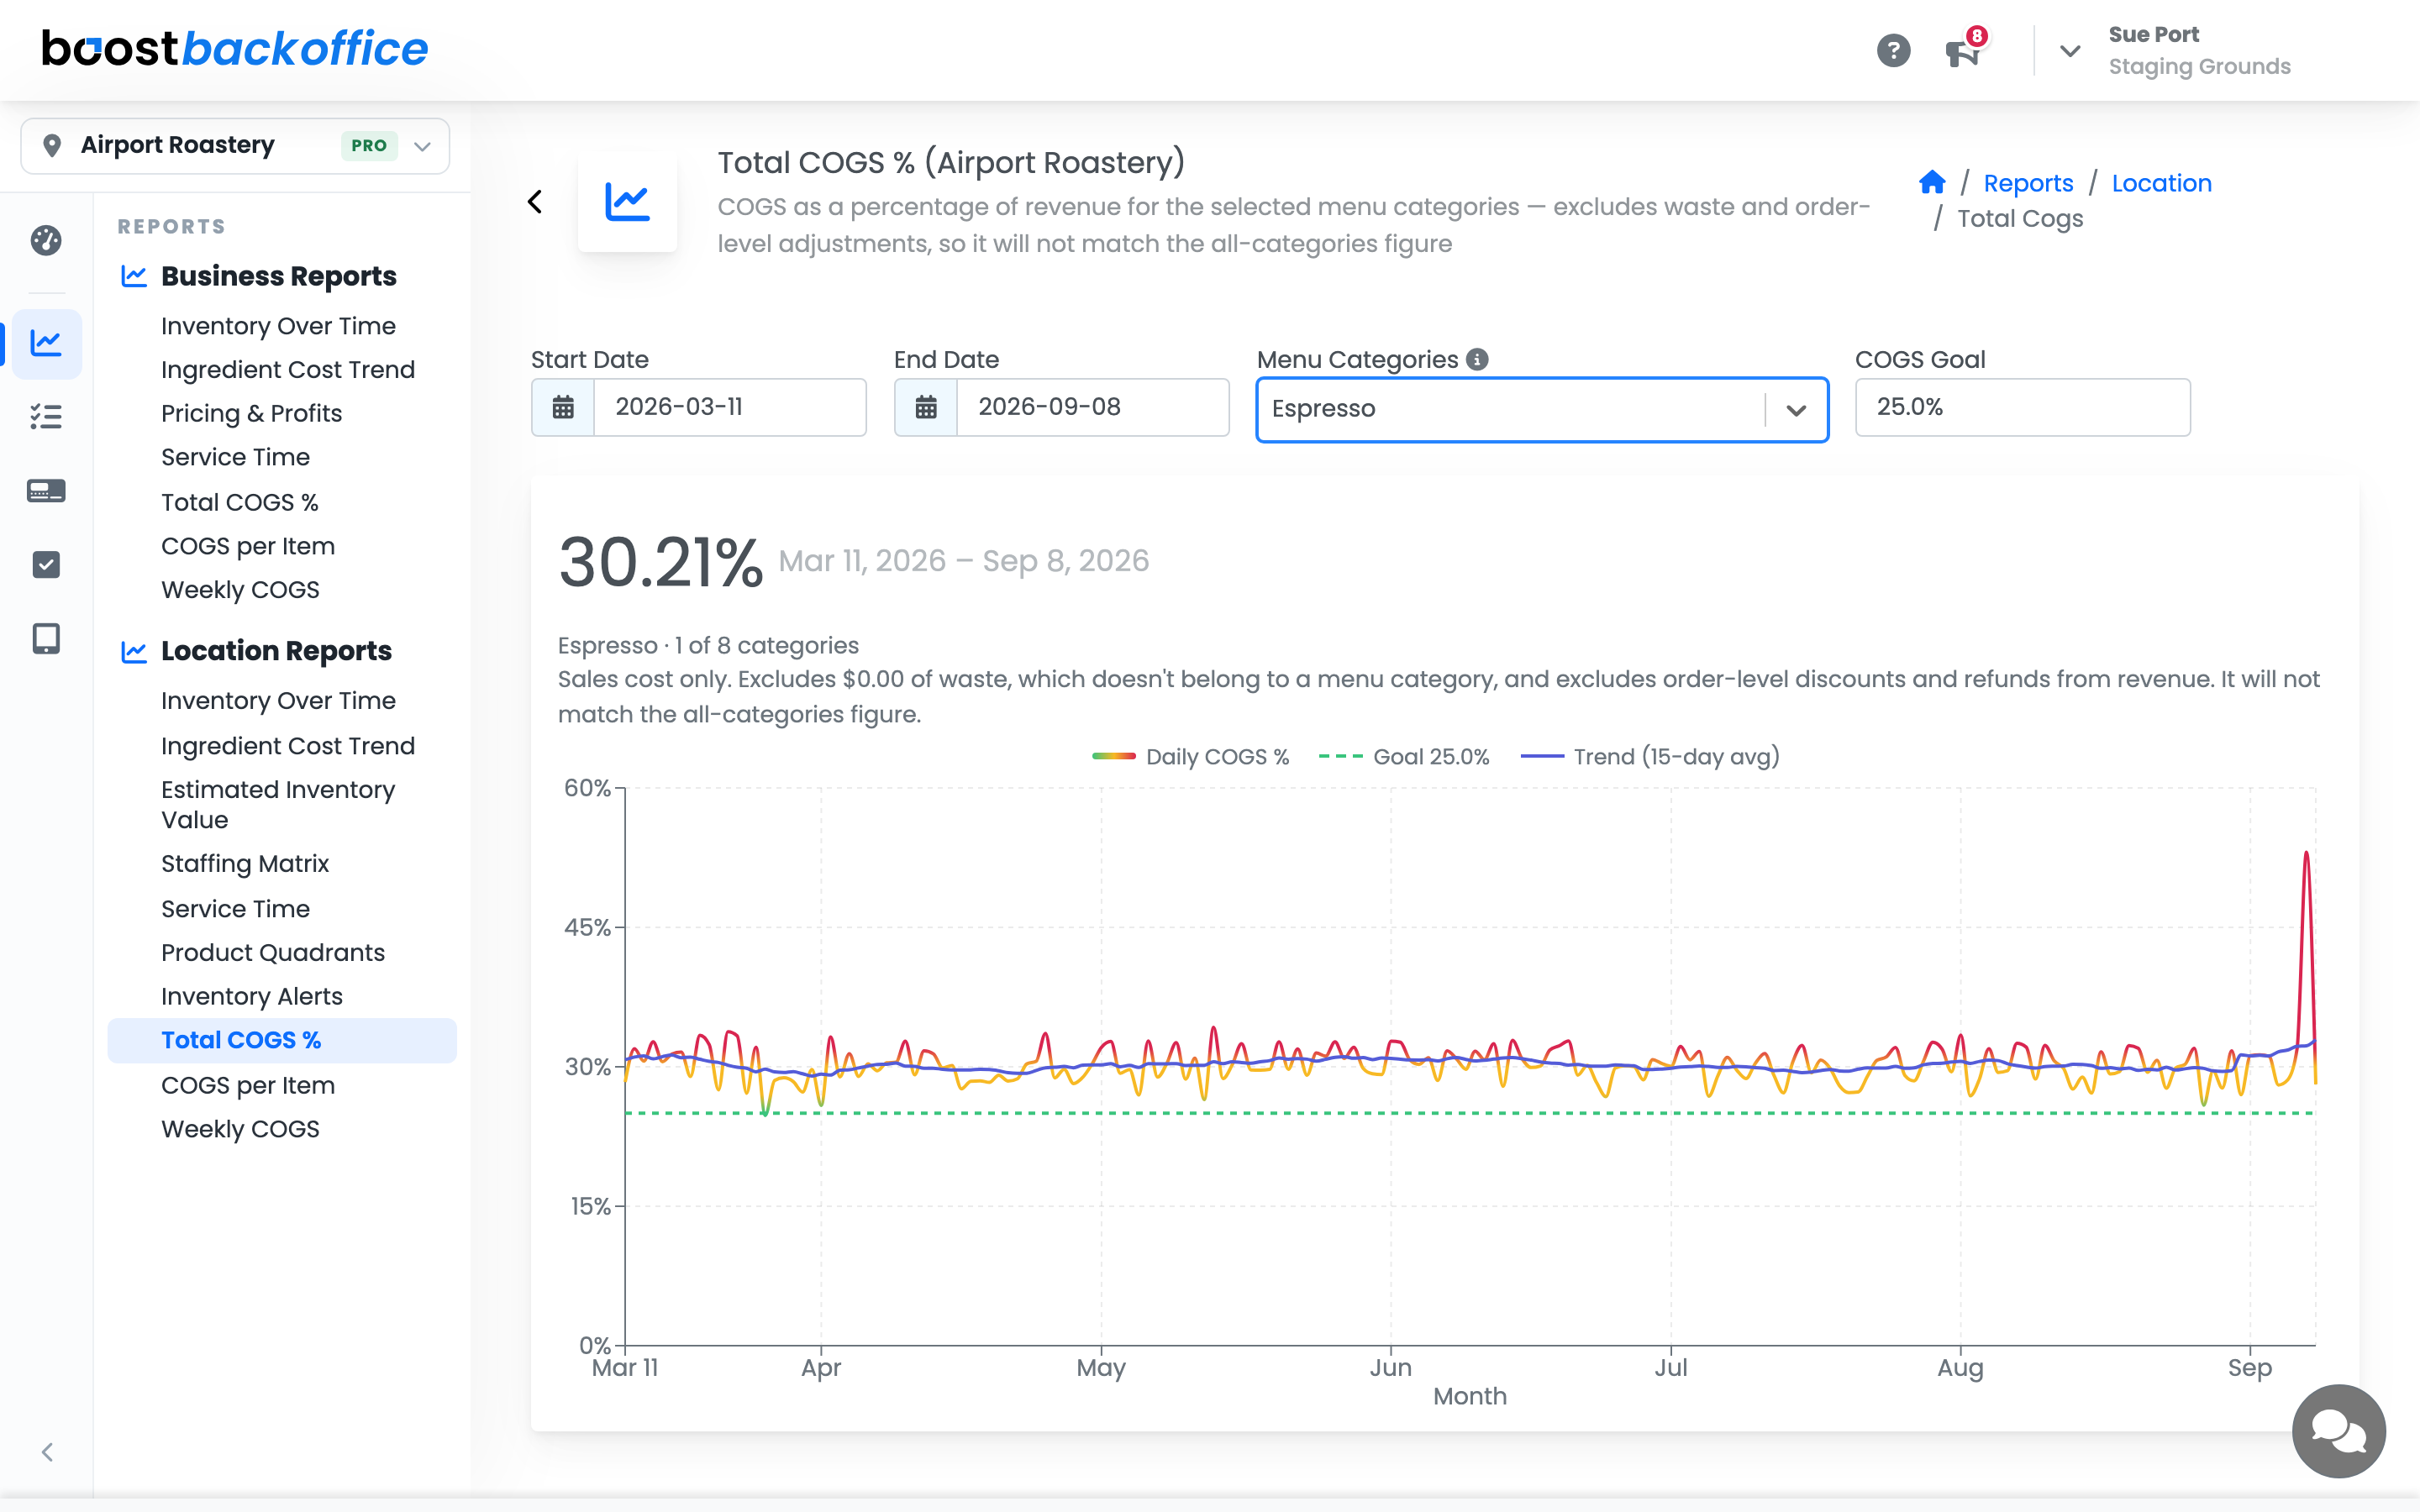
Your COGS Goal line stays on the chart while a category is selected, so you still have something to read the number against.
Note
A filtered figure will not add up to the all-categories headline, and it is not meant to. Compare a category against itself over time rather than against the total.
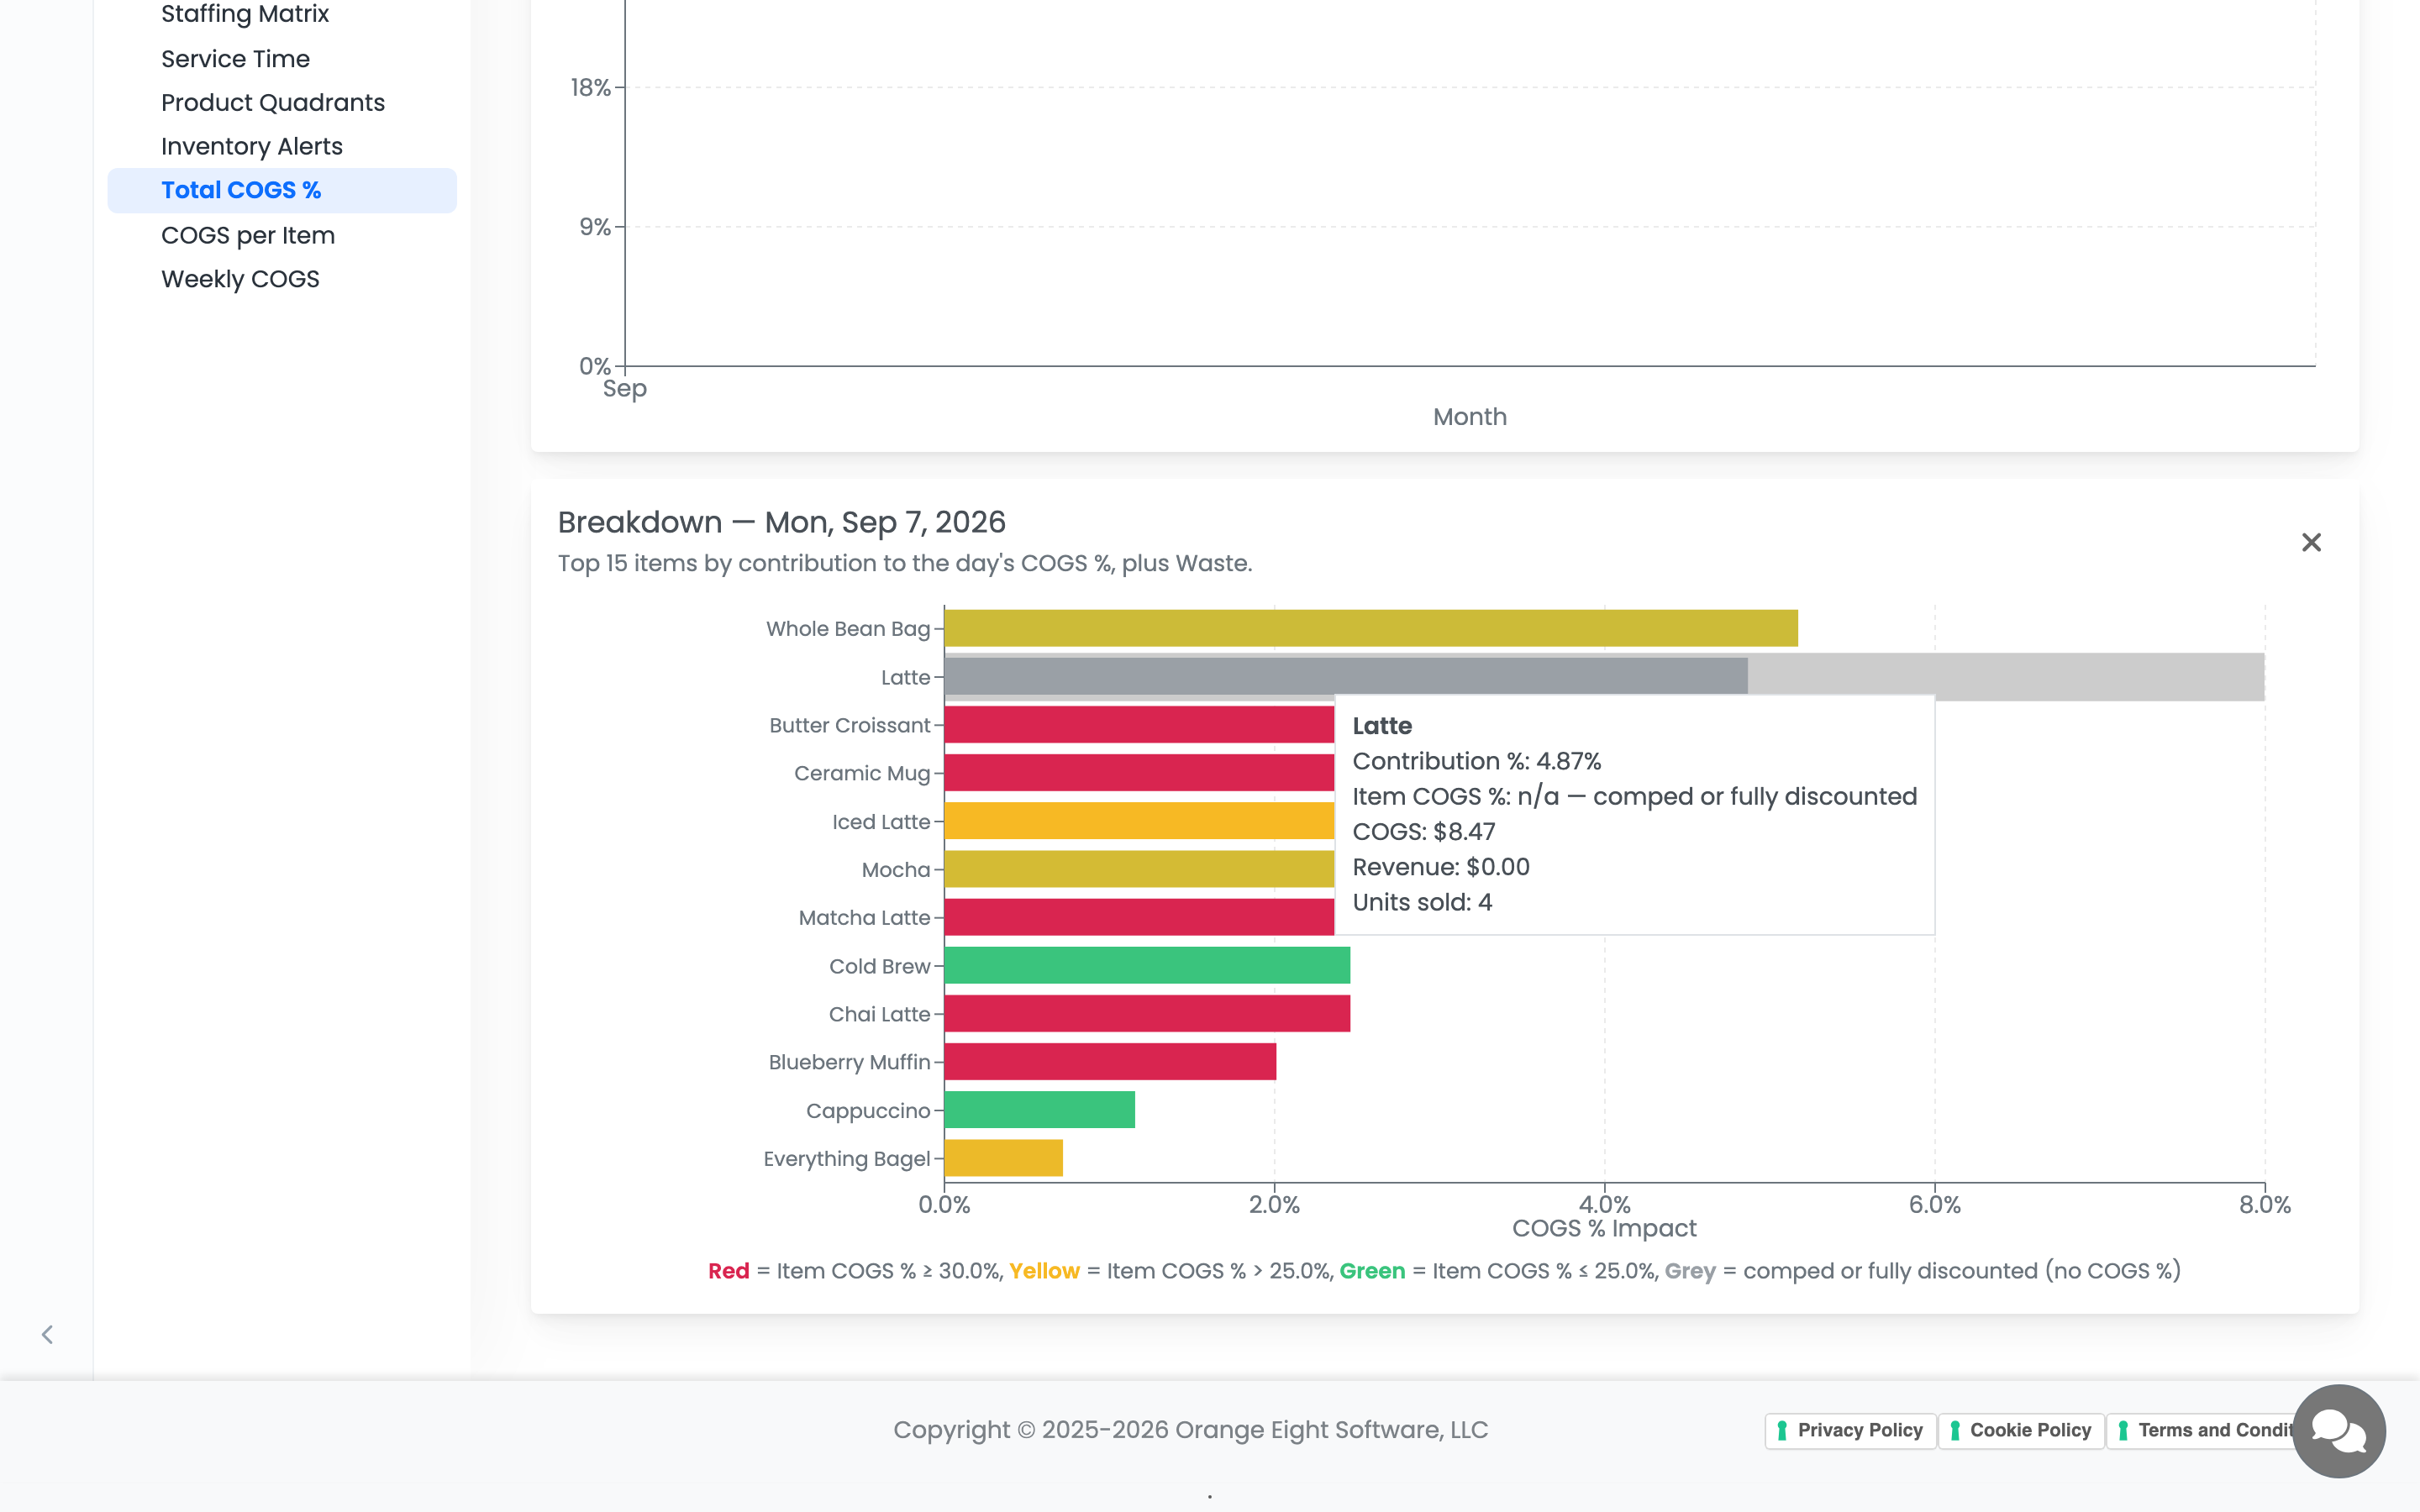
Click any day on the chart while a category is selected and the breakdown below lists only the items in that category, ranked by what they did to that day's number. That is usually where a syrup change or a shrinking pour turns up.
COGS per Item: what is behind the number?
COGS per Item averages actual item revenue and COGS by day and draws a COGS % trend line over it. When the total moves and you cannot explain it, this is where the explanation lives, because it points at an item rather than at a mood.
Revenue here is what you actually collected. A discount or a comp comes off the item before the percentage is worked out, so a morning of free refills reads as the cost it was rather than hiding behind full menu prices.
When an item collected nothing
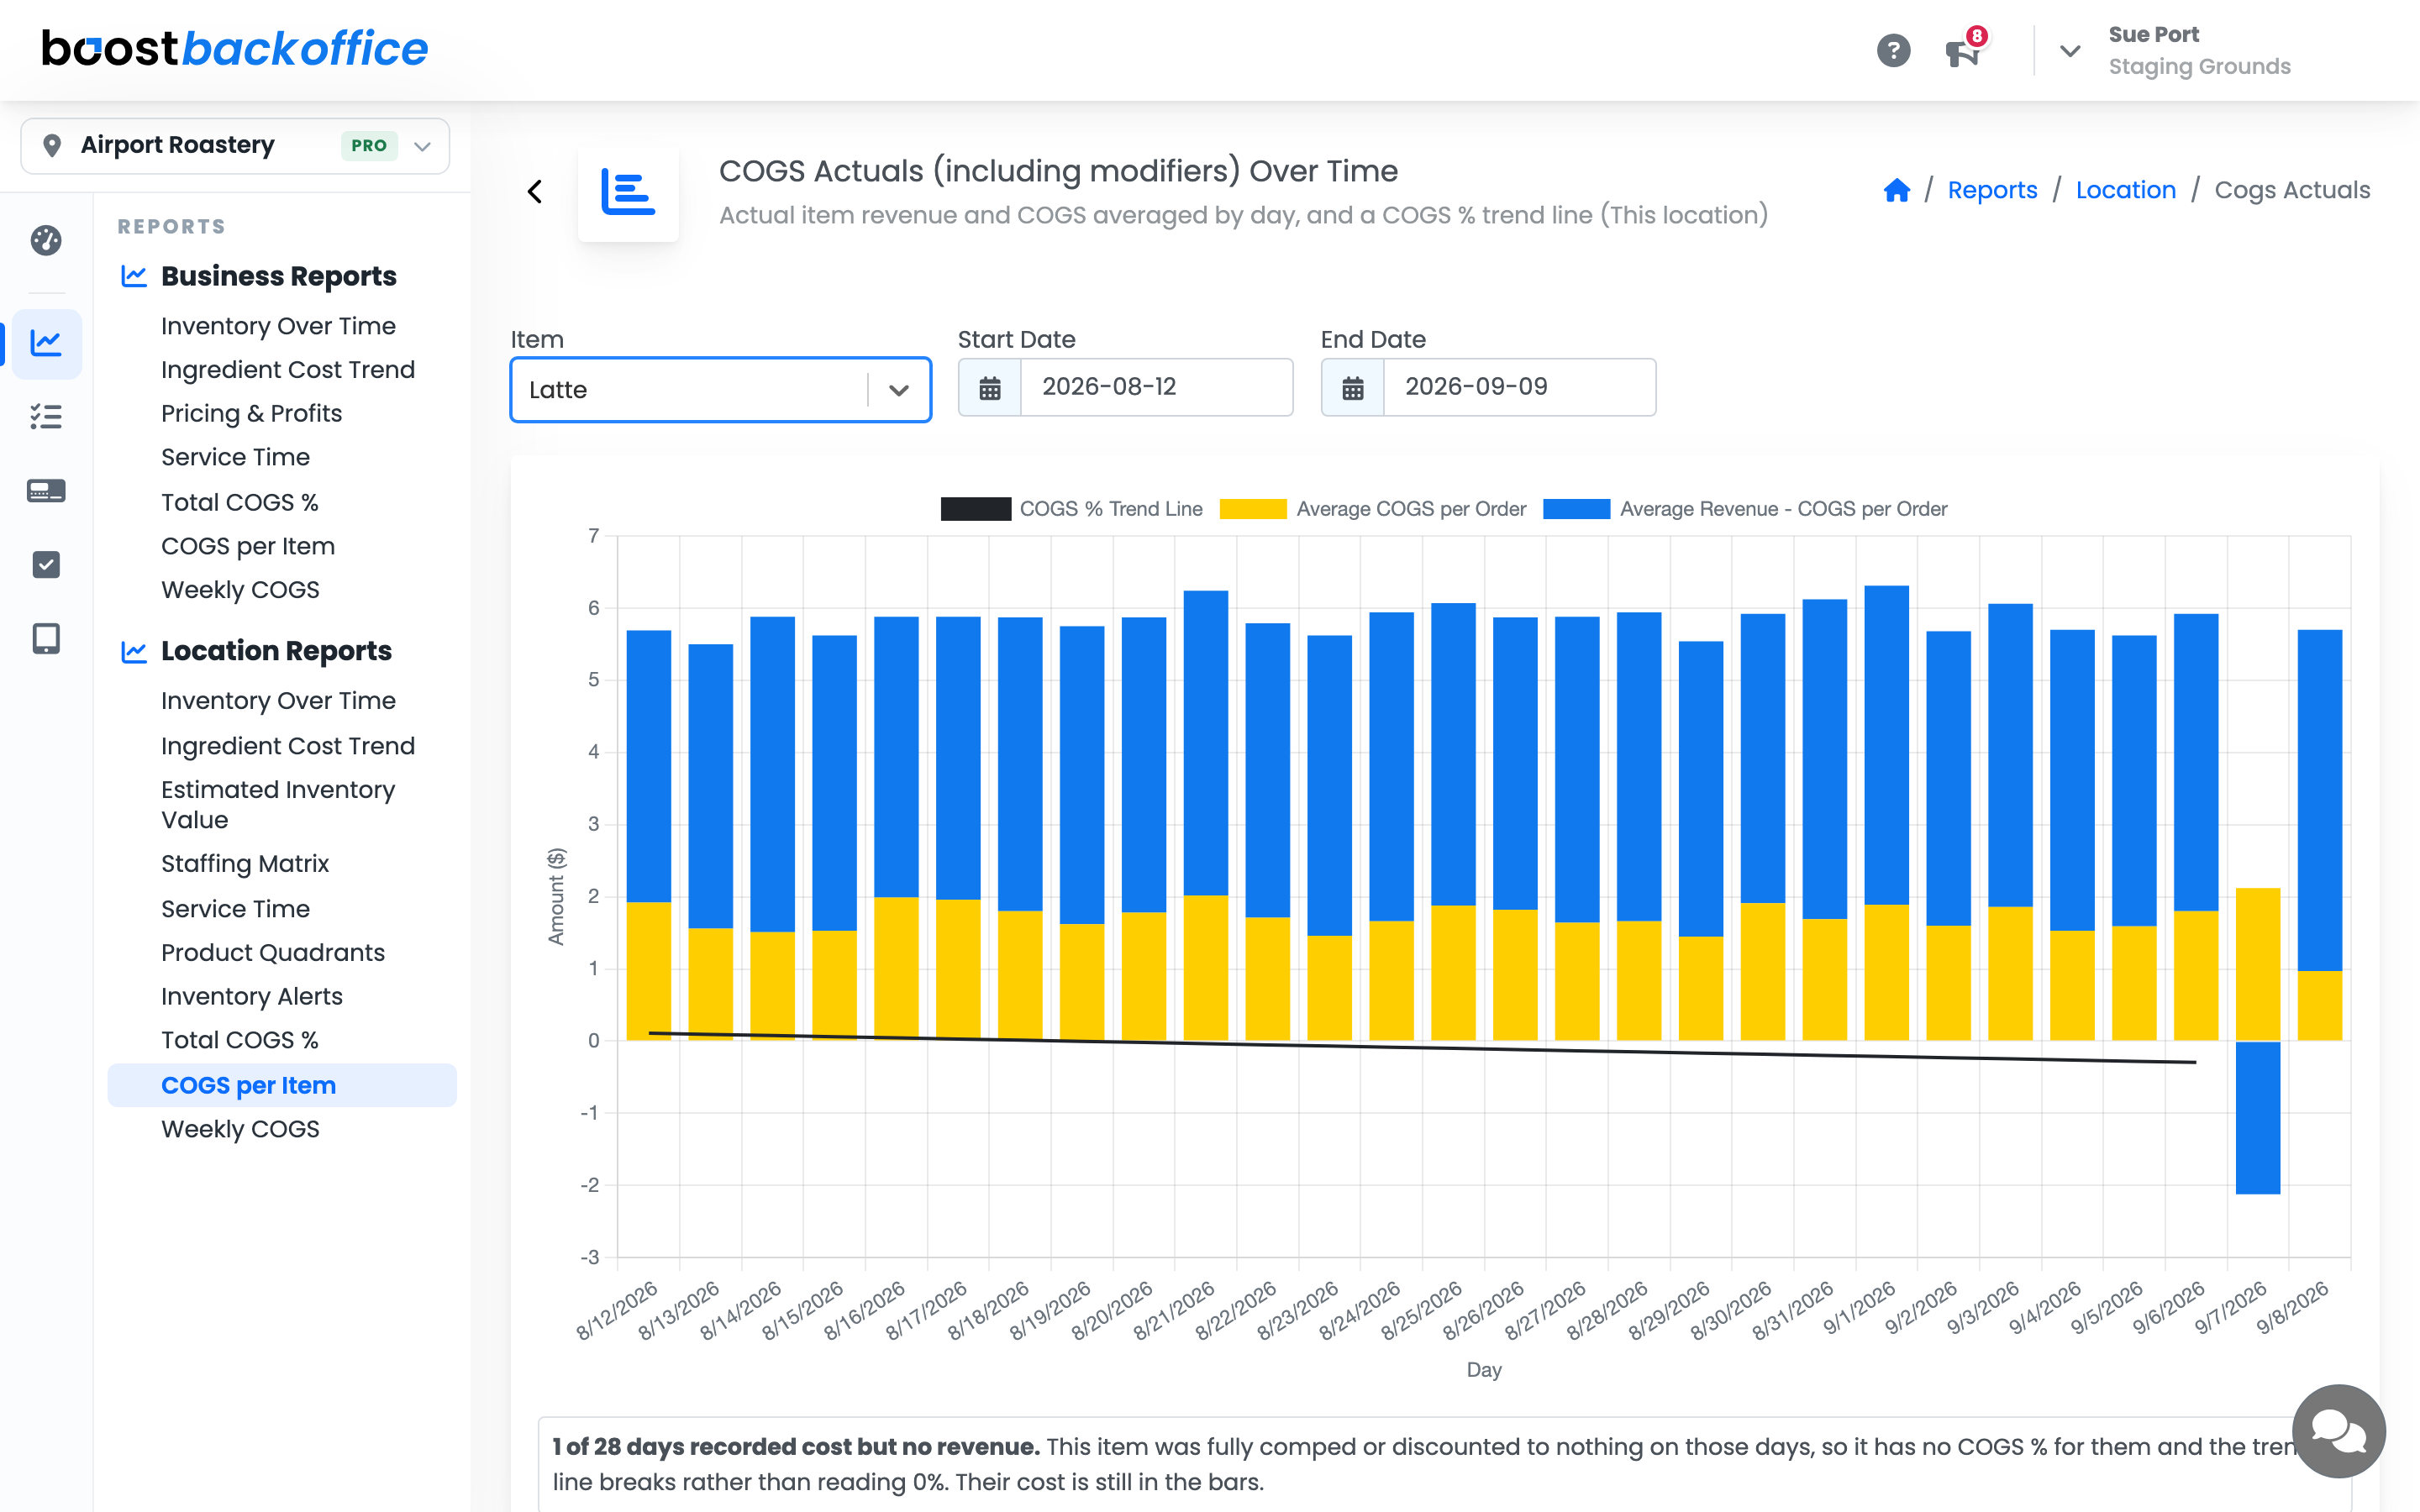
Some days an item takes no money at all, because it was comped or discounted to zero. There is no percentage to be had from nothing, so rather than printing a flattering 0% the reports say so plainly.
- COGS per Item counts those days in a line under the chart and breaks the trend line over them instead of letting a zero drag it to the floor. The cost is still in the bars.
- The day breakdown turns the item grey and its tooltip reads not available. Its cost still counts toward the day, so the item keeps its place in the ranking.
Note
Expect anything you discount to read a little higher than it used to. That is the discount landing where it always belonged, not the report changing its mind.
Weekly COGS: what do we show the team?
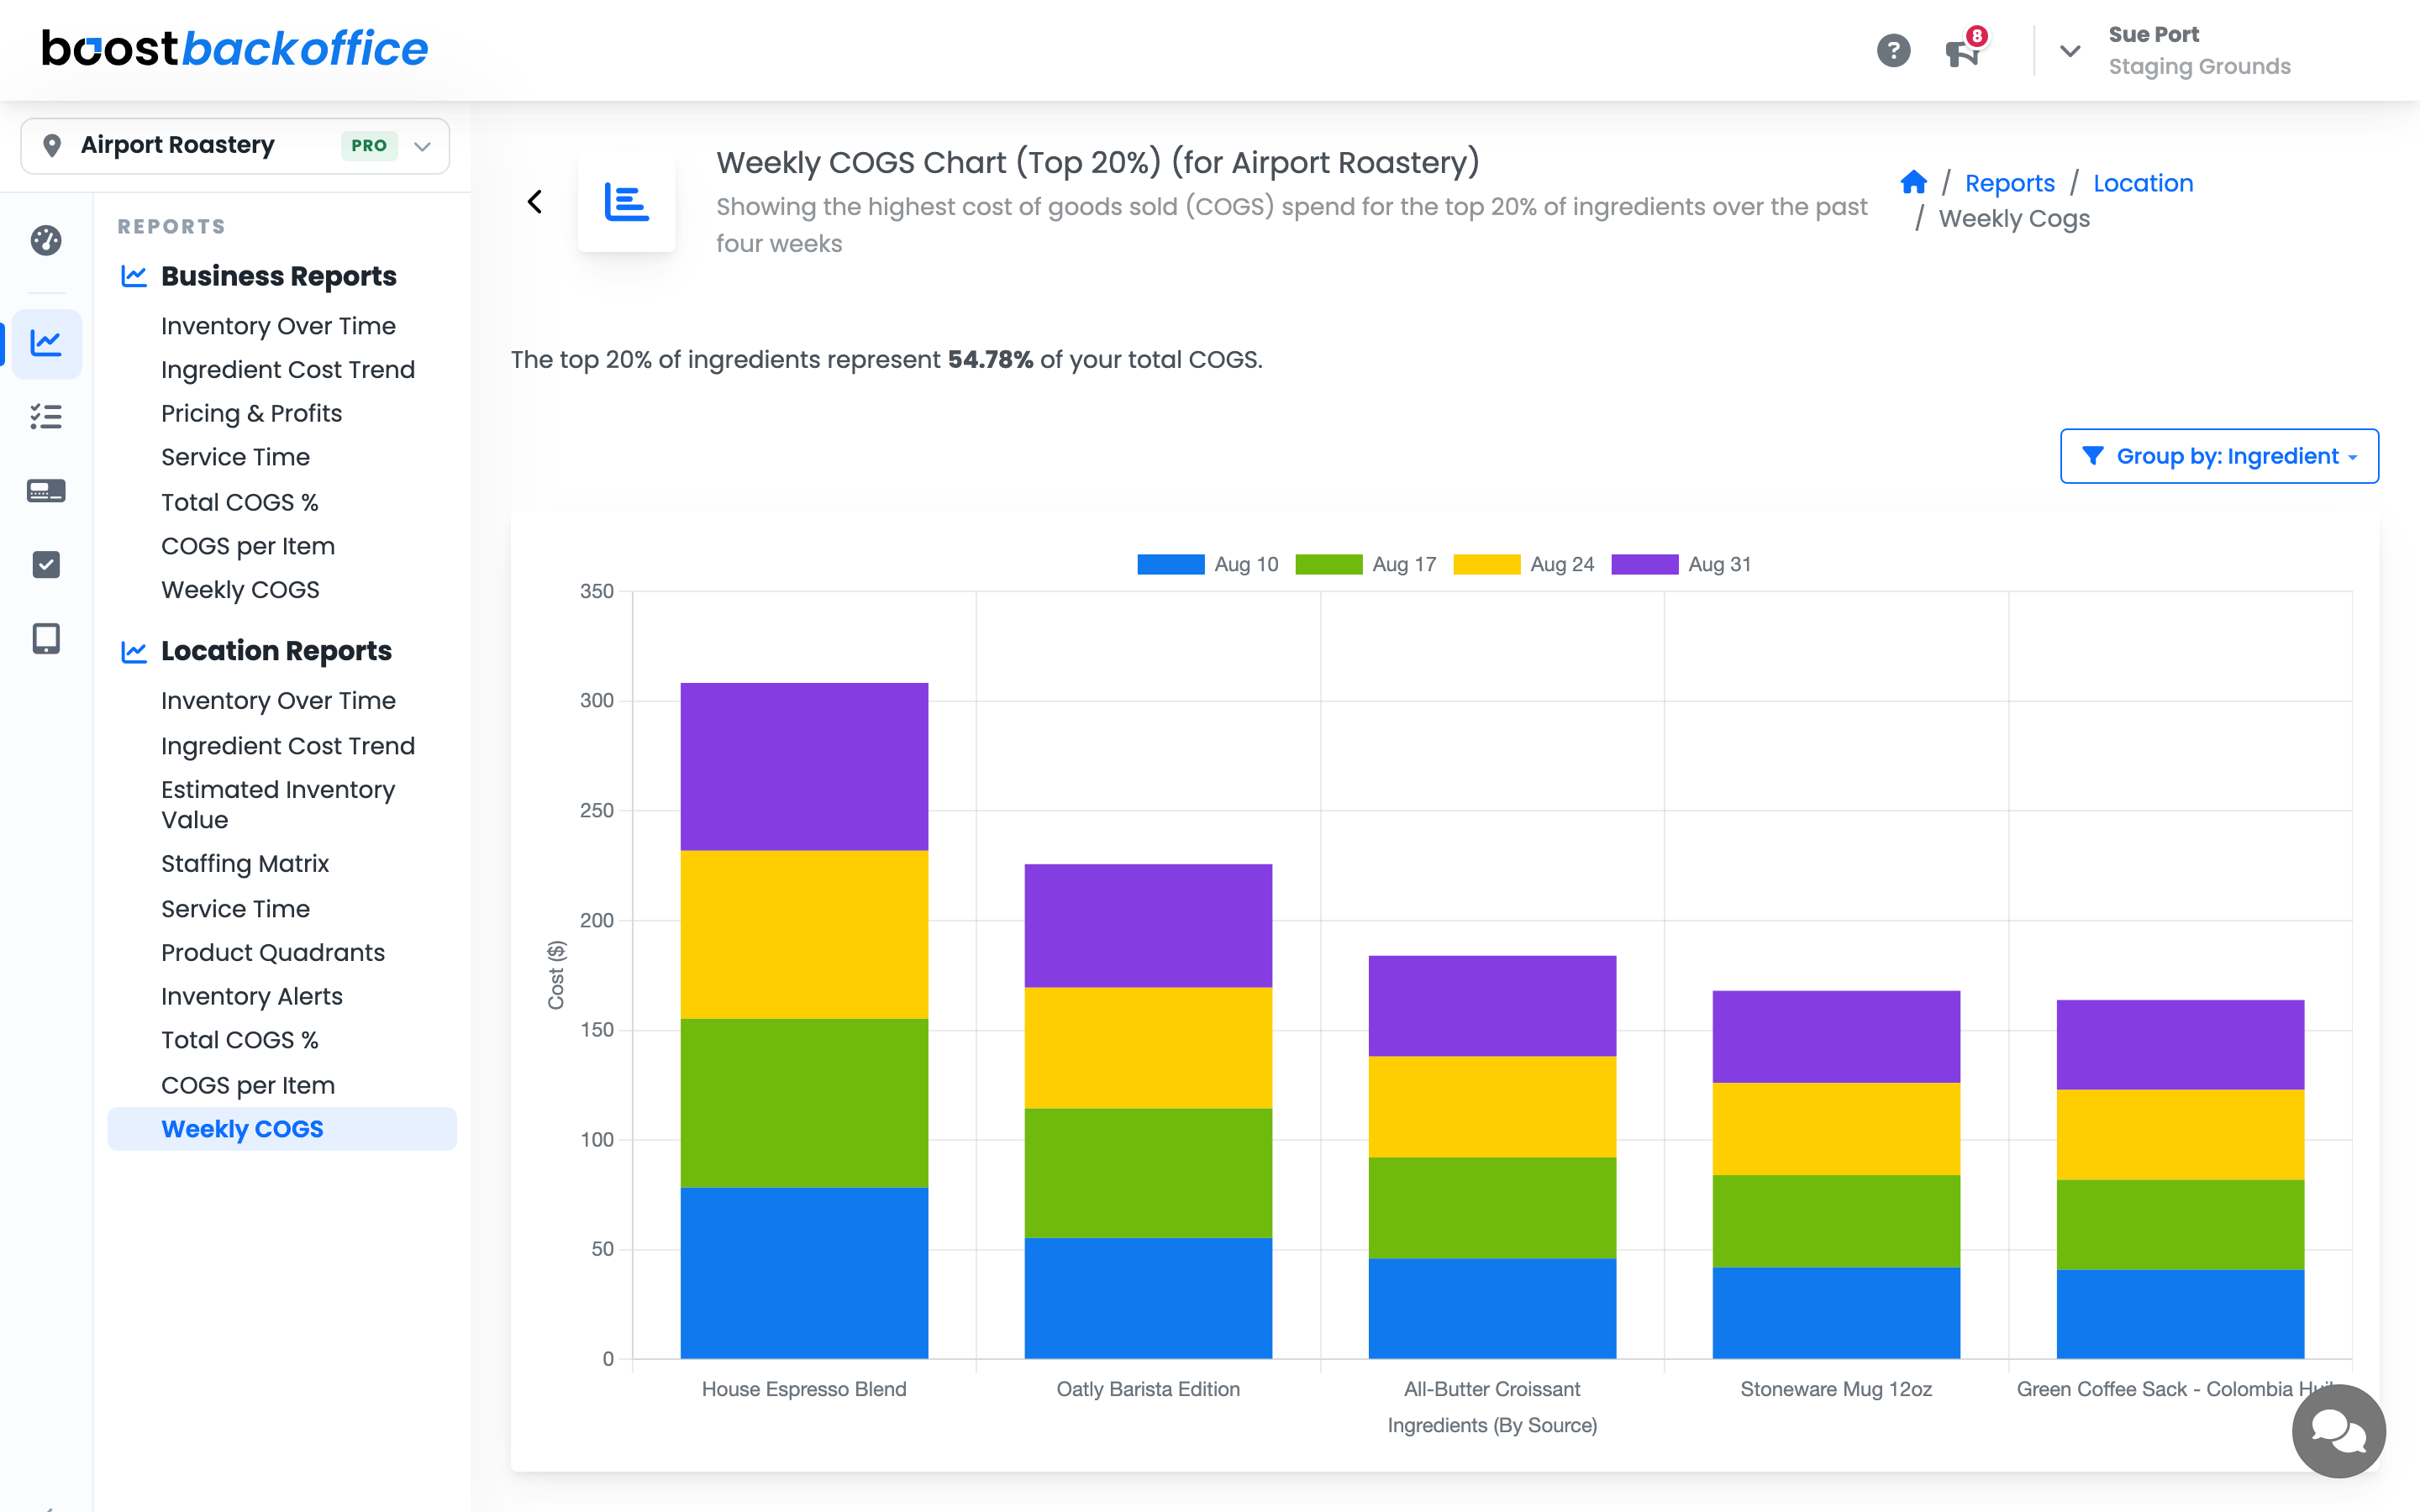
Weekly COGS rolls the same data up by week. Daily numbers bounce around too much to be motivating; weekly ones are steady enough that a team can see whether last week's change worked.
Making the numbers trustworthy
COGS is worked out from POS sales matched to your recipes, so three things decide whether you can trust it:
- Every menu item has a recipe
- Modifiers that consume product are linked to ingredients
- Ingredient costs match your latest invoices
Revenue from items with no recipe is excluded rather than counted at zero cost, so the number can never understate your COGS. It can be noisy while you are still setting up, though, which is normal for the first few weeks.
What you should see
A trend line sitting at or under your goal, weekly figures steady enough to talk about in a team meeting, and a per-item view that explains any month that surprised you.
Account Level: Pro