
Reading the Pricing and Profits Report
Contents4 sections
Menus grow one special at a time, and prices get set once and left. This report puts what a drink costs you next to what you charge, every size, all in one place.
Open the report
Go to Reports > Business Reports > Pricing & Profits. Items are grouped into tabs by category, and each item shows a row per size.
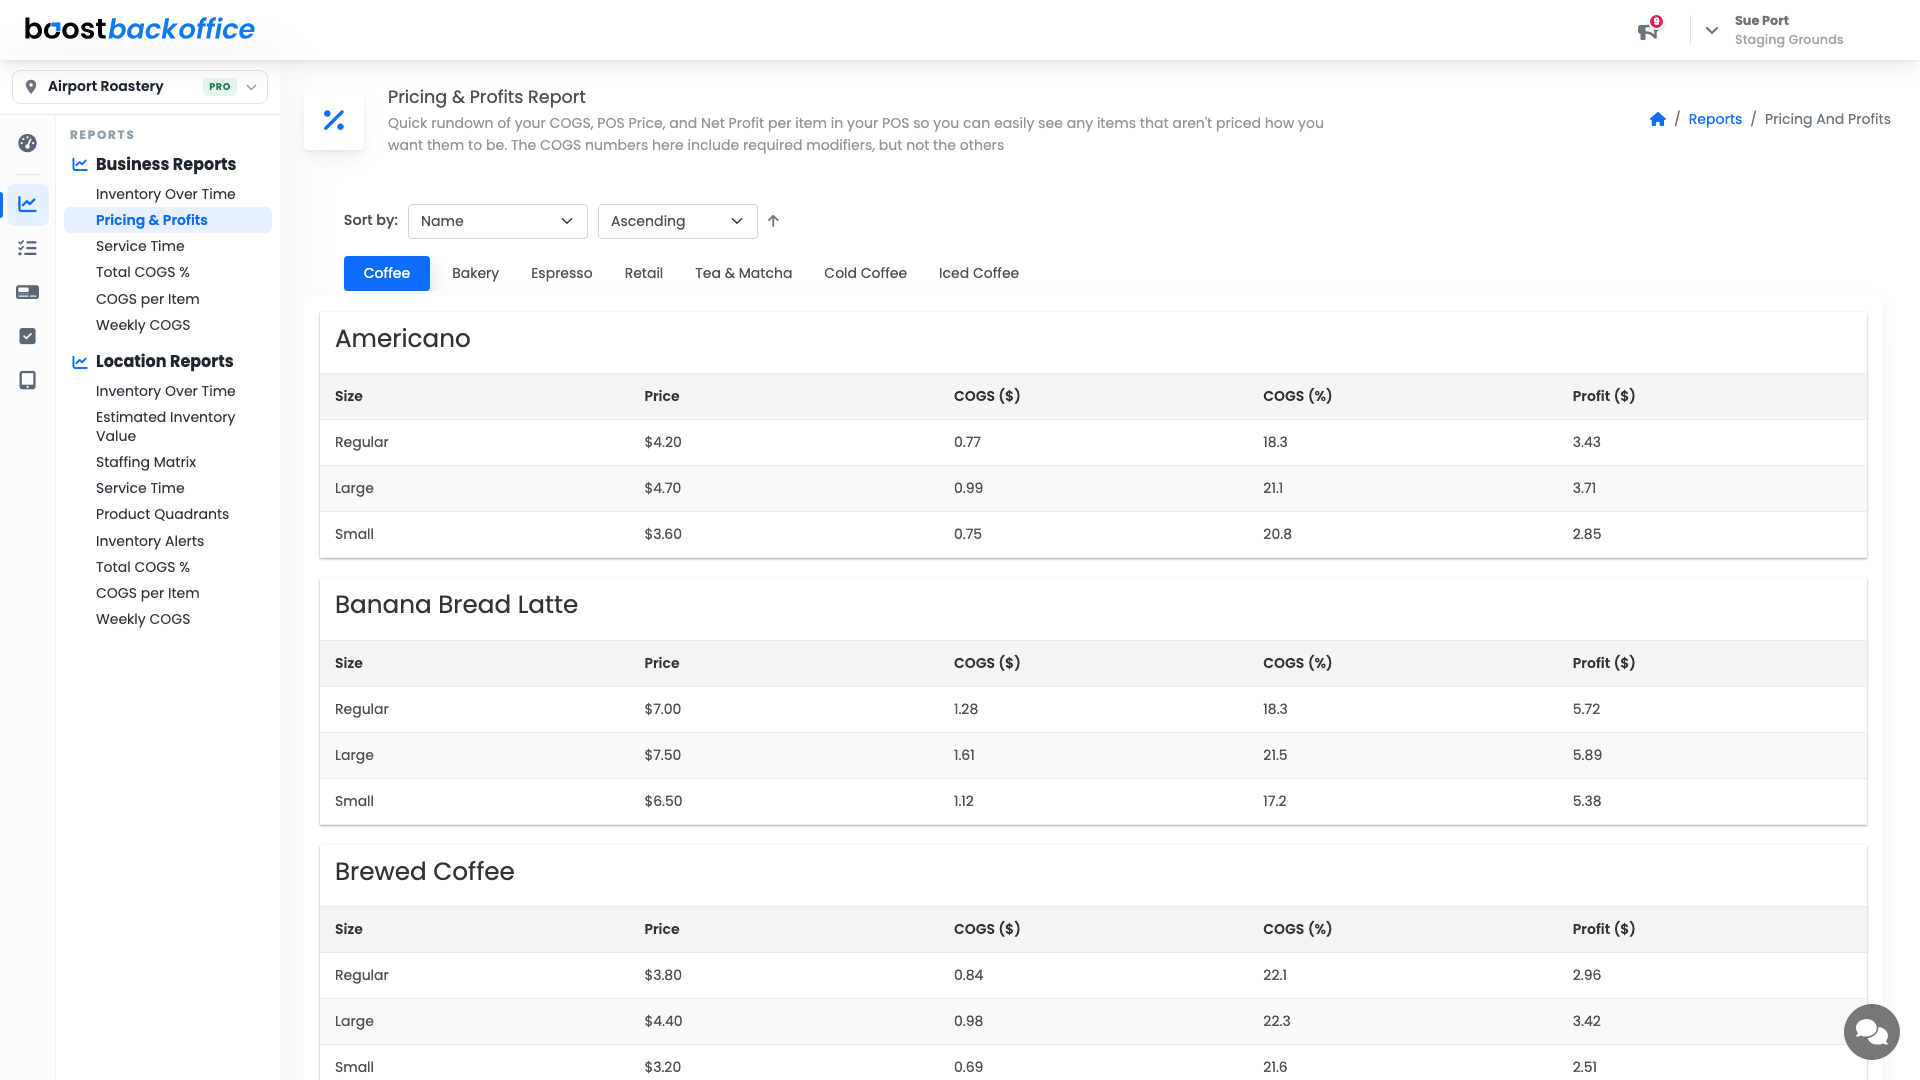
| Column | What it means |
|---|---|
| Price | What you charge on the POS |
| COGS ($) | What that size costs you to make |
| COGS (%) | That cost as a share of the price |
| Profit ($) | What is left over |
Sort by COGS (%) descending and the first screen is your problem list.
What to look for
- A size that is out of line with its siblings. If the large runs eight points higher than the regular, the recipe amounts for that size are usually the cause, not the price.
- An item well above your target COGS. Either the price has not moved with your costs, or the recipe uses more than you think.
- An item far below. Not always good news. A very cheap drink can mean a recipe with ingredients missing from it.
Important
The COGS figures here include required modifiers but not optional ones. A drink whose default milk is included will read accurately; the oat milk upcharge someone chose is not in this number.
Fixing what you find
A number that looks wrong is usually one of three things: an ingredient cost that has not been updated since the last price rise, a recipe amount that does not match what your team actually pours, or a POS price that never moved. All three are quick to fix, and this report is where you notice they need it.
What you should see
Every size of every item earning what you intended, with no surprises sitting in the middle of a category you have not looked at in a year.
Account Level: KDS & Pro