

Reading the Service Time Report
Contents5 sections
Everyone remembers the morning that went badly. Service Time turns that memory into numbers you can compare week to week, and points at the hours where the promise slips.
Open the report
Go to Reports > Location Reports > Service Time, set your date range, and set the On-time goal you hold yourself to.
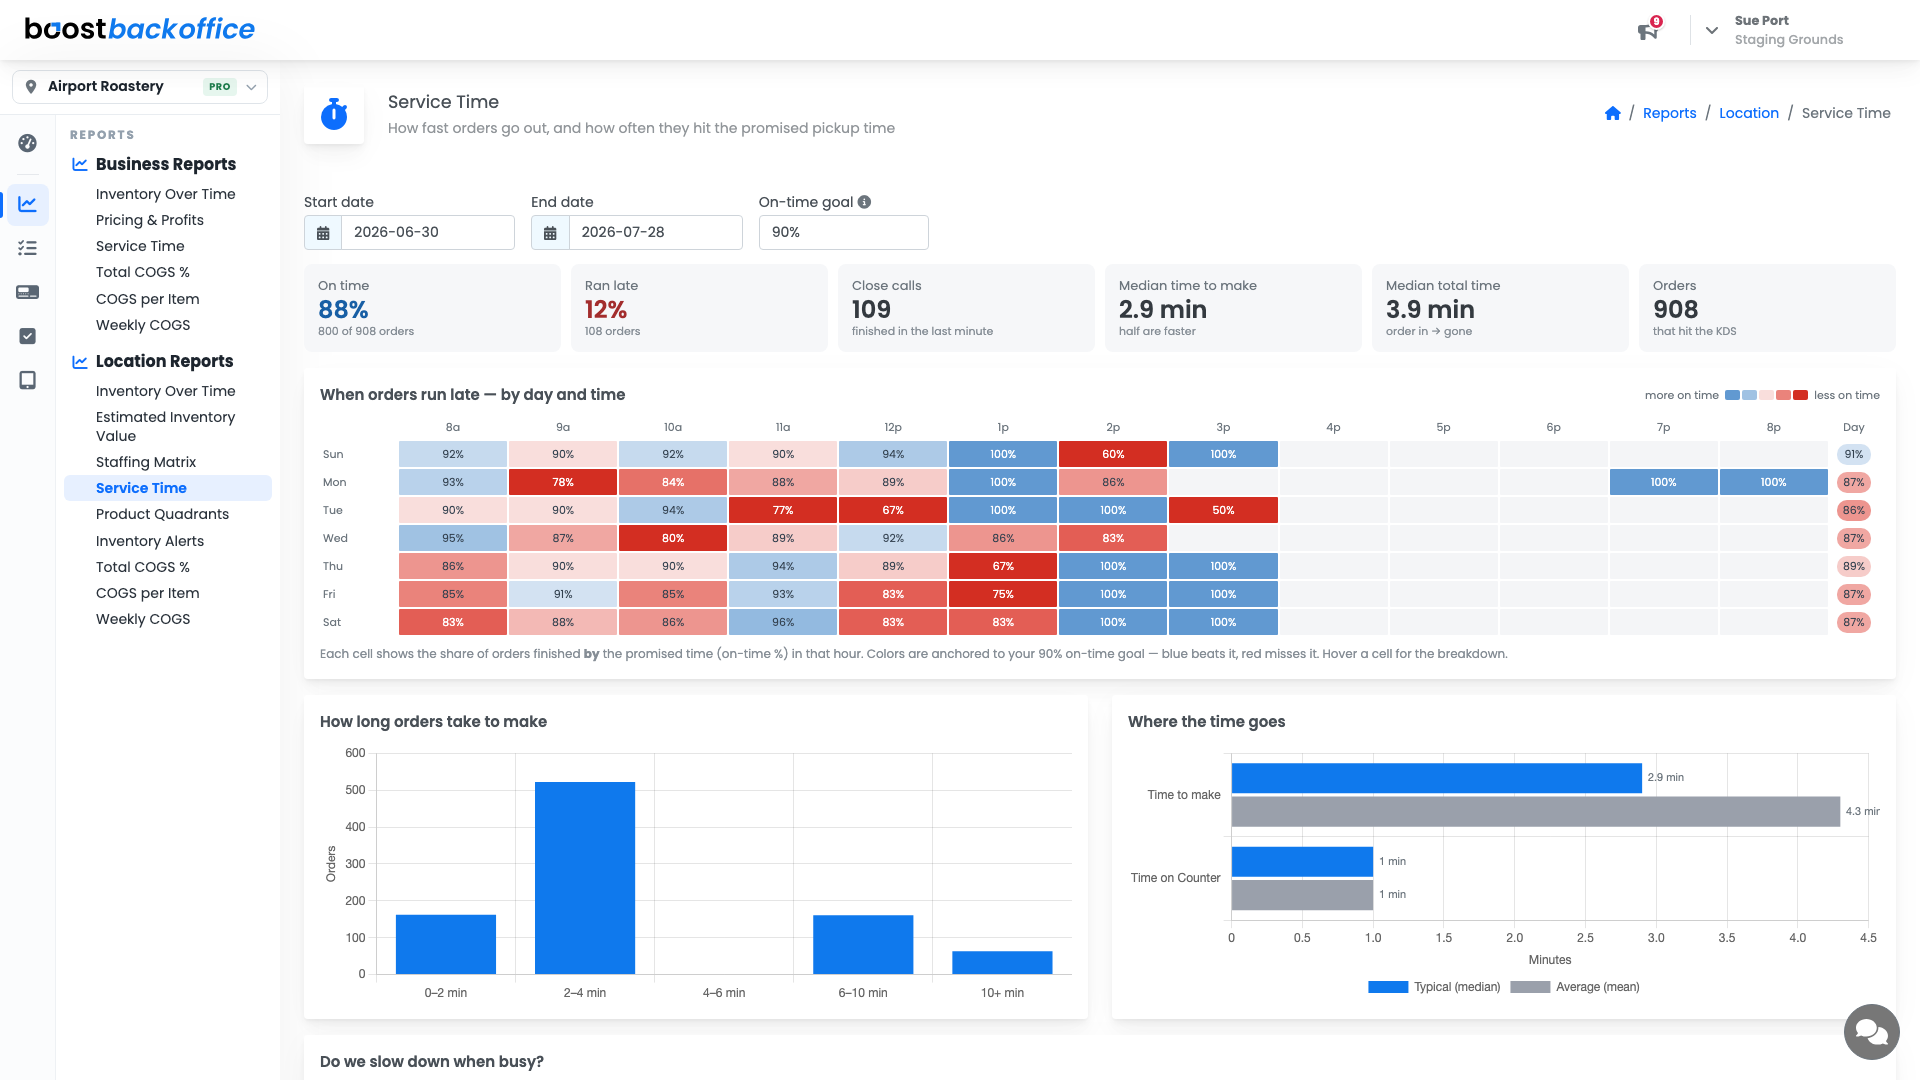
The headline numbers
| Tile | What it tells you |
|---|---|
| On time | The share of orders finished by the promised time |
| Ran late | The ones that missed it |
| Close calls | Orders finished in the last minute before the promise |
| Median time to make | Half your orders are faster than this |
| Median total time | Order in to order gone, the number the customer feels |
| Orders | How many hit the KDS in the period |
Close calls is the tile people miss. A high close-call count with a good on-time rate means you are one busy Saturday away from a bad one.
When orders run late
The heatmap is a cell per day and hour showing the share of orders finished on time, coloured against your goal: blue beats it, red misses it. A day column on the right gives each day's overall rate.
Read it for patterns rather than single cells. A red column at 2pm every day is a staffing or prep problem with a time attached. A red row on Saturdays is a volume problem.
Tip
Put this heatmap next to the Staffing Matrix grid. Red cells here that line up with thin cells there answer their own question.
Where the time goes
Two more charts break the number down: how long orders take to make, bucketed from under two minutes to over ten, and where the time actually goes, split between time to make and time on counter, each shown as both the typical median and the average.
The median and the mean together are the useful part. When the average is well above the median, a small number of very slow orders is dragging your service, and those are usually one item or one station rather than the whole shop.
What you should see
An on-time rate at or above the goal you set, a heatmap without a standing red column, and a make-time distribution with a short tail.
Account Level: KDS & Pro