
Reading the Operations Dashboard
Contents7 sections
The Operations Dashboard is the screen Boost Back Office drops you on after you sign in, and it exists to answer one question fast: is this location in good shape right now?
What you are looking at
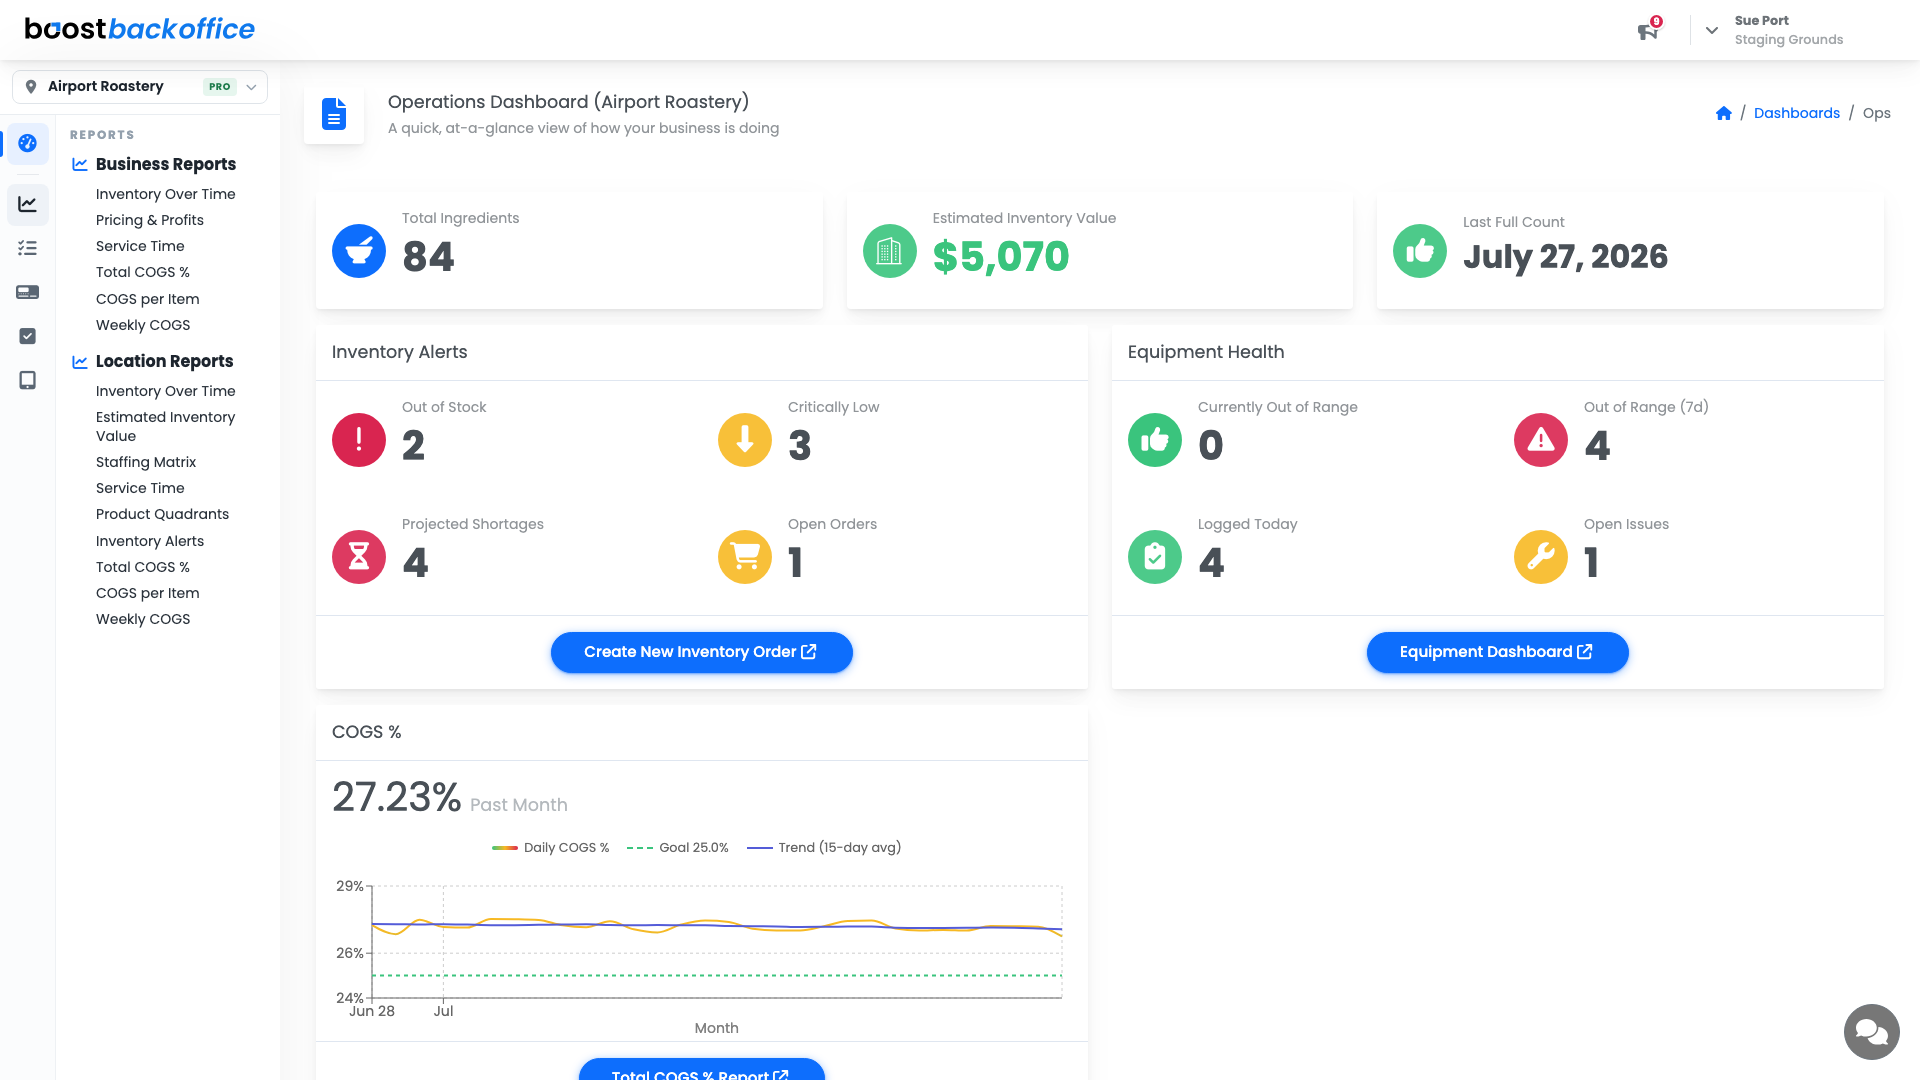
Everything on the dashboard follows the location picker at the top left, so the title always names the shop you are reading. Switch locations and every number on the page follows along.
Your shelf in three numbers
The top row is the ten second version of your inventory.
| Tile | What it tells you |
|---|---|
| Total Ingredients | How many ingredients this location is tracking |
| Estimated Inventory Value | What the stock on those shelves is worth right now |
| Last Full Count | The date of the most recent full count, so you know how current that value is |
Estimated Inventory Value is only as trustworthy as your last count, which is exactly why the two sit side by side. A value that looks wrong is usually a count that is overdue.
Tip
If Last Full Count is further back than you would like, start a fresh one from Inventory > Count > Inventory Count. Counting is what turns an estimate into a number you can order against.
Catch shortages before they cost you a sale
The Inventory Alerts card is the early warning system.
- Out of Stock is what you have already run out of.
- Critically Low is what you are about to run out of.
- Projected Shortages is what your own usage says will run out inside the reorder window, before anything looks low.
- Open Orders is how much help is already on the way.
Green thumbs mean nothing needs you. A red or amber tile is a number worth clicking into.
Check what needs prepping
The card beside the alerts covers everything you make yourself. Prep recipes have no supplier, so they never show up in the buying alerts — this is where they appear instead.
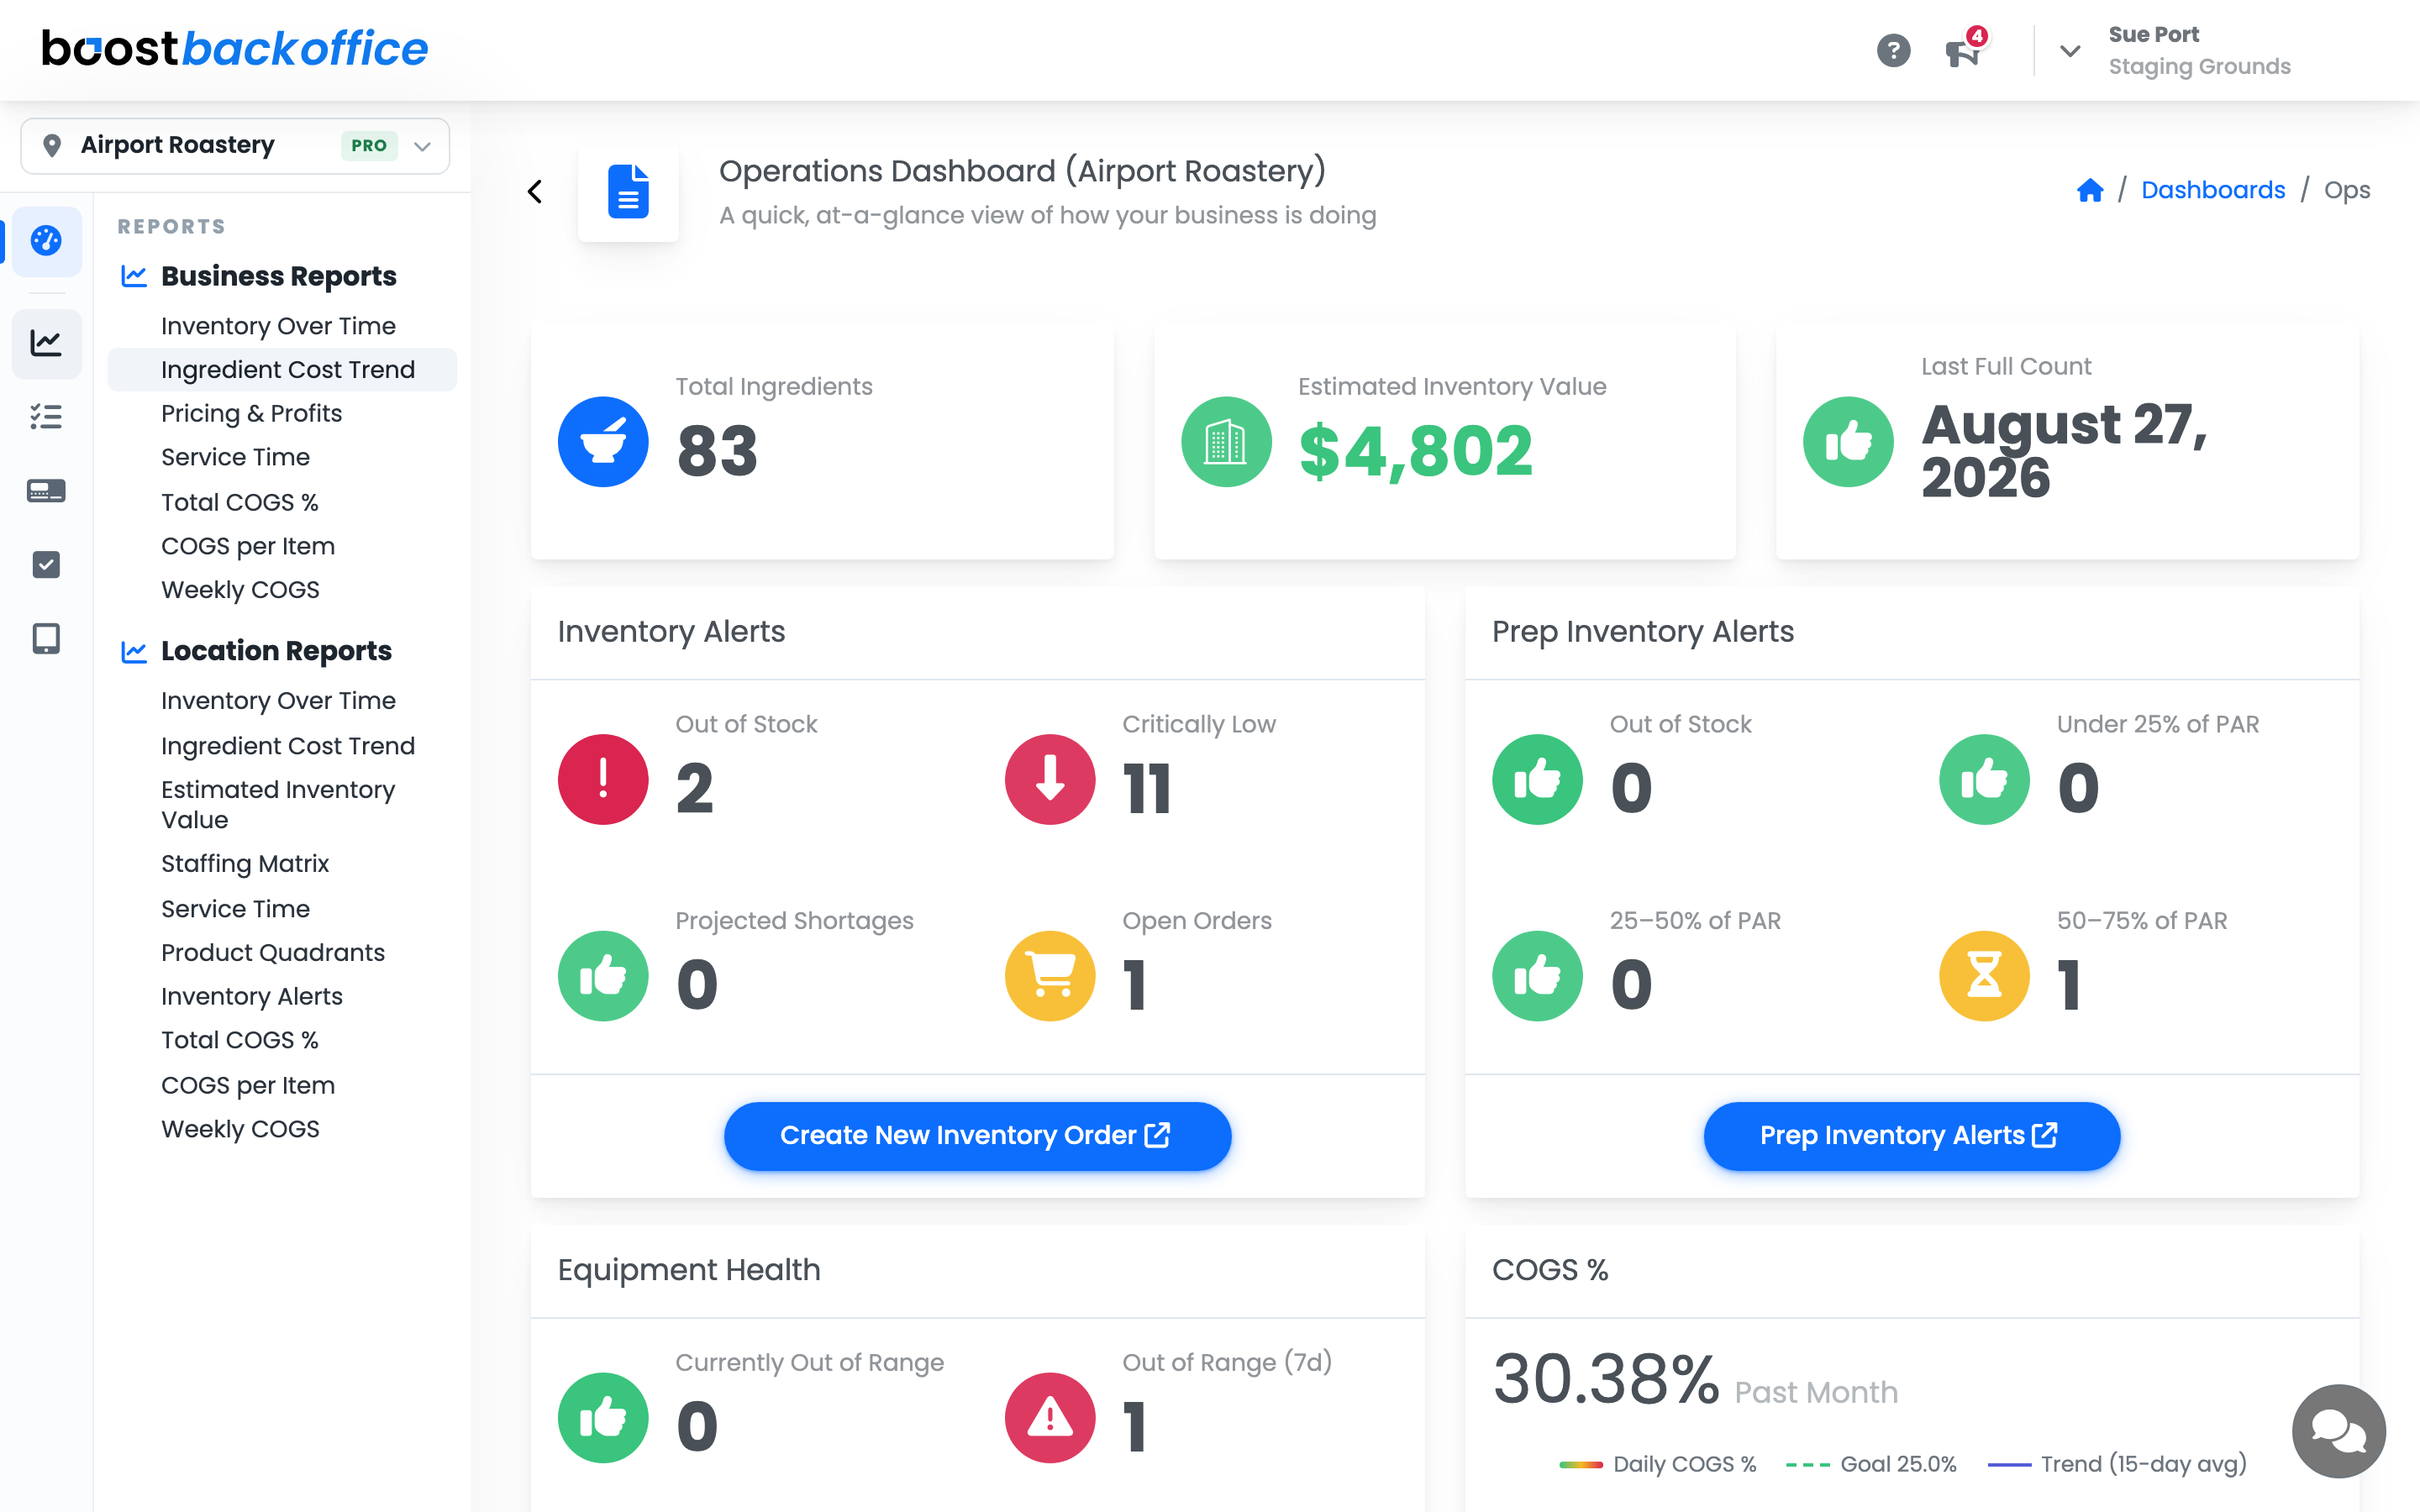
The four tiles sort your prep by how much of PAR is still on hand: out of stock, under 25%, 25 to 50%, and 50 to 75%. That is the same measure the kitchen notification screen uses for its Running Low list, so the office and the back of house agree.
Any tile opens the Inventory Alerts report already switched to the prep items behind that number.
Turn an alert into an order
Create New Inventory Order at the bottom of the alerts card opens a fresh order for the location you are already looking at, so the trip from problem to purchase order is one click.
Equipment and COGS at a glance
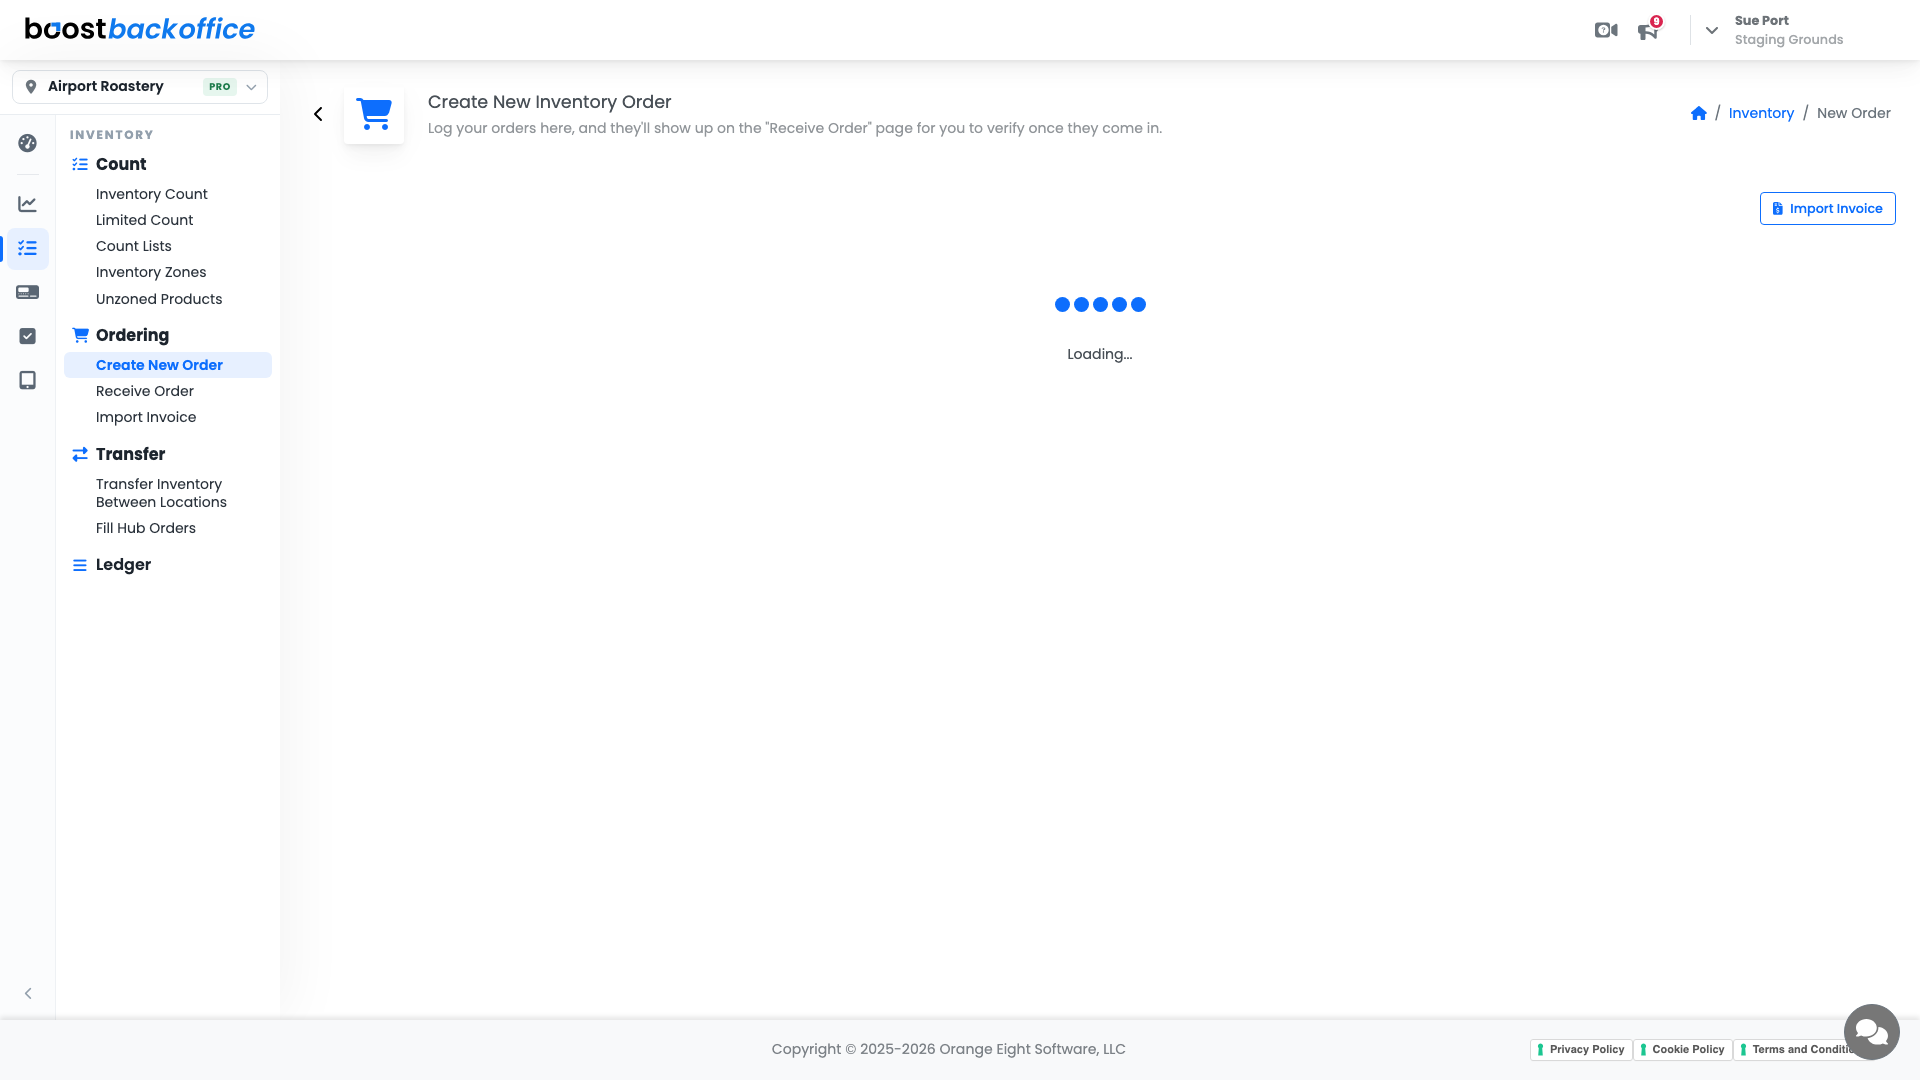
Pro locations get two more cards on the same screen.
Equipment Health counts what is currently out of range, what went out of range in the last seven days, how many logs your team recorded today, and how many issues are still open. Equipment Dashboard opens the full view.
COGS % charts your cost of goods against your goal line, with a fifteen day trend so one heavy delivery day does not read as a crisis. The headline number is the past month.
Note
COGS % is worked out from POS sales matched to your recipes. Revenue from items with no recipe yet is left out, so the number cannot understate your costs. Expect some swings while you are still filling in recipes, ingredient costs, and pack sizes.
What you should see
A dashboard that names your location, three tiles that agree with what is actually on your shelves, and alert cards that are green when the shop is stocked and running. When they are not, you are one click from the screen that fixes it.
Account Level: All. Projected Shortages, Equipment Health, and the COGS chart are Pro.