

Reading the Menu Engineering Quadrants
Contents4 sections
Two numbers decide whether a menu item earns its place: how many you sell, and how much you make on each one. Menu Engineering plots both at once and sorts your menu into four groups that each want something different from you.
Open the chart
Go to Reports > Location Reports > Product Quadrants, or the business-wide version under Business Reports. Toggle between Items and Sizes, and filter to a category when a comparison across the whole menu is too noisy.
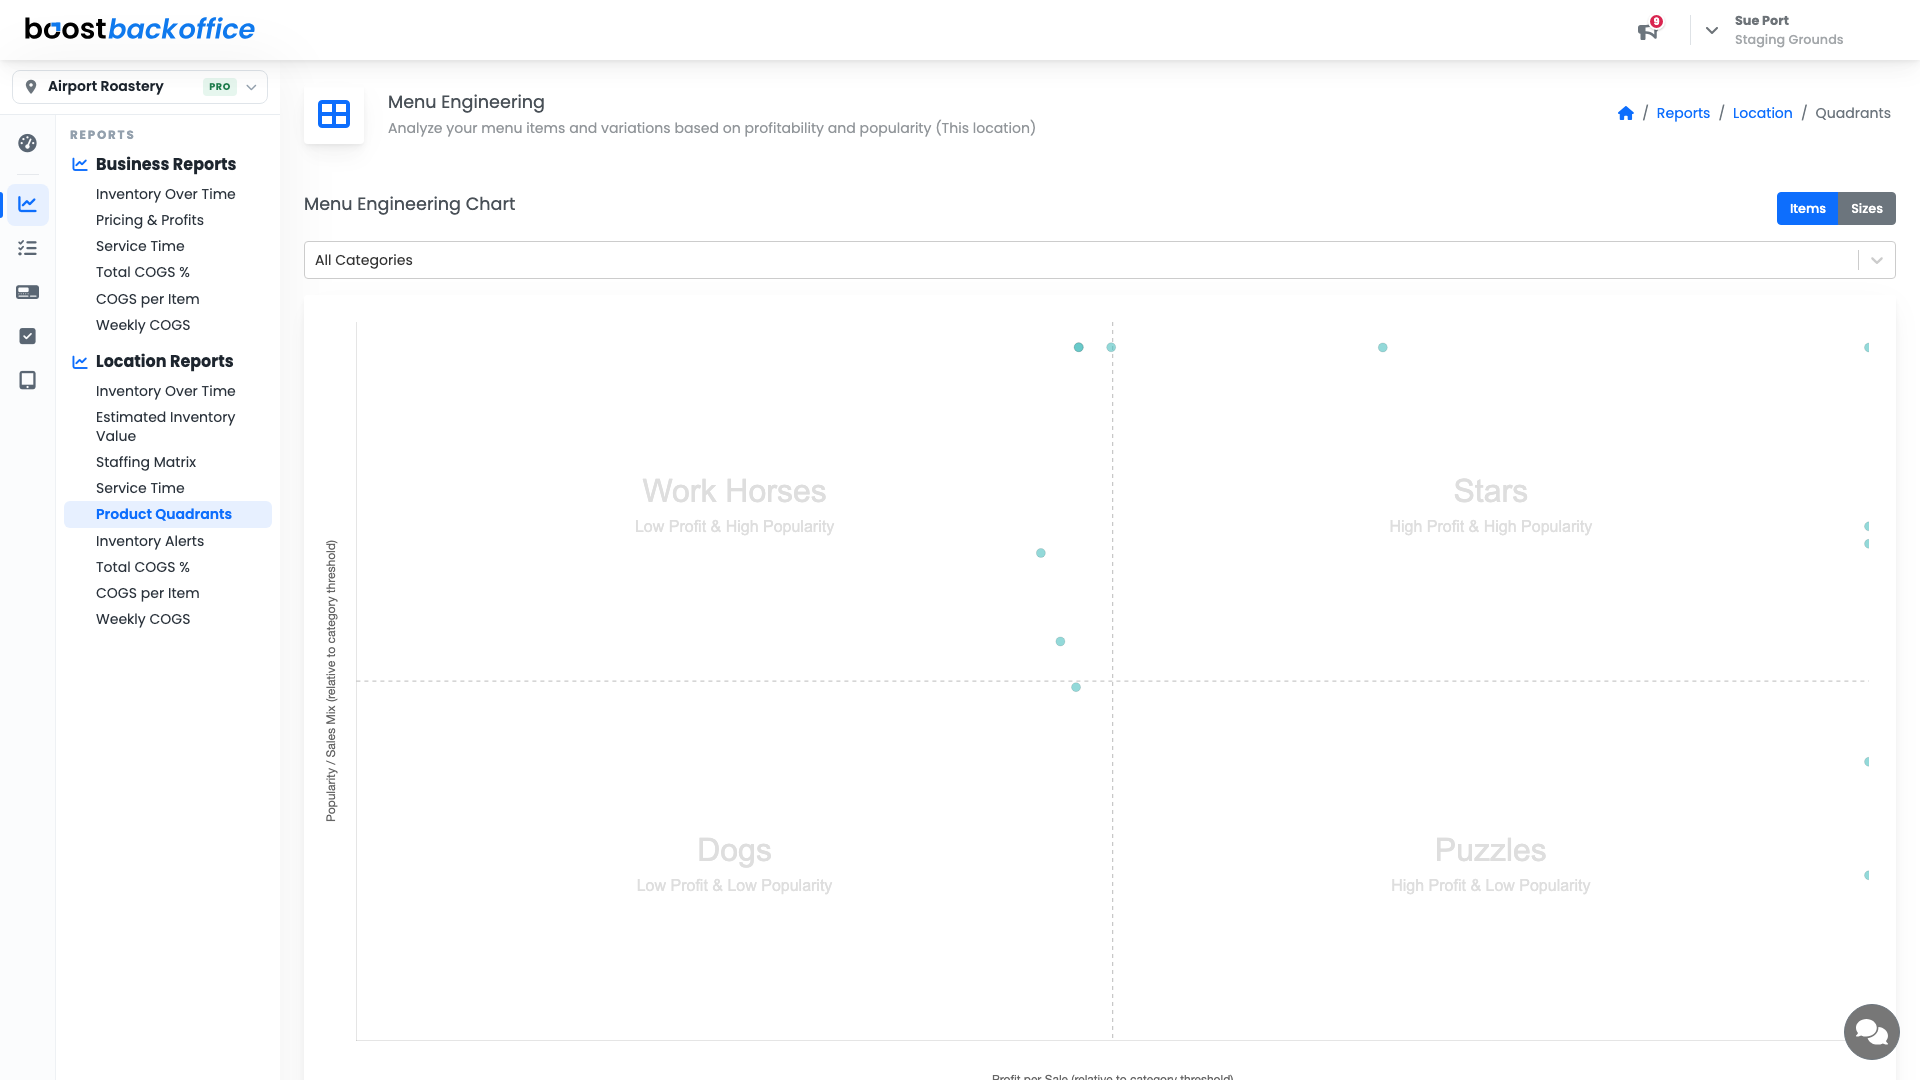
Each dot is an item. Across is profit per sale, up is popularity or sales mix, and both are measured against the threshold for its category, so a pastry is judged against pastries rather than against espresso.
The four groups
| Quadrant | What it is | What to do |
|---|---|---|
| Stars | High profit, high popularity | Protect them. Keep them on the board, in staff recommendations, and never out of stock |
| Work Horses | Low profit, high popularity | People love them. Find margin in the recipe or the price rather than dropping them |
| Puzzles | High profit, low popularity | Worth selling harder. Better placement, a staff push, a photo |
| Dogs | Low profit, low popularity | Candidates to retire, or to rework into something else |
Tip
Work the Puzzles before the Dogs. Moving one high-margin item that nobody notices is usually easier than fixing something that is both unpopular and unprofitable.
Before you trust the placement
The chart is only as honest as the recipes behind it. An item missing ingredients looks far more profitable than it is and will sit in Stars or Puzzles under false pretences. If something looks too good, open its recipe first.
Note
Thresholds are relative to the category, so an item's quadrant can change when you filter. That is intended: it is asking whether an item earns its place among its peers.
What you should see
A menu you can talk about in four groups instead of forty rows, and a short list of items that deserve a decision this month.
Account Level: KDS & Pro