

Reading the Estimated Inventory Value Report
Contents4 sections
This is the money version of your shelf. Every ingredient you have on hand, what it is worth at what you paid for it, and how long it will last at the rate you have been using it.
Open the report
Go to Reports > Location Reports > Estimated Inventory Value.
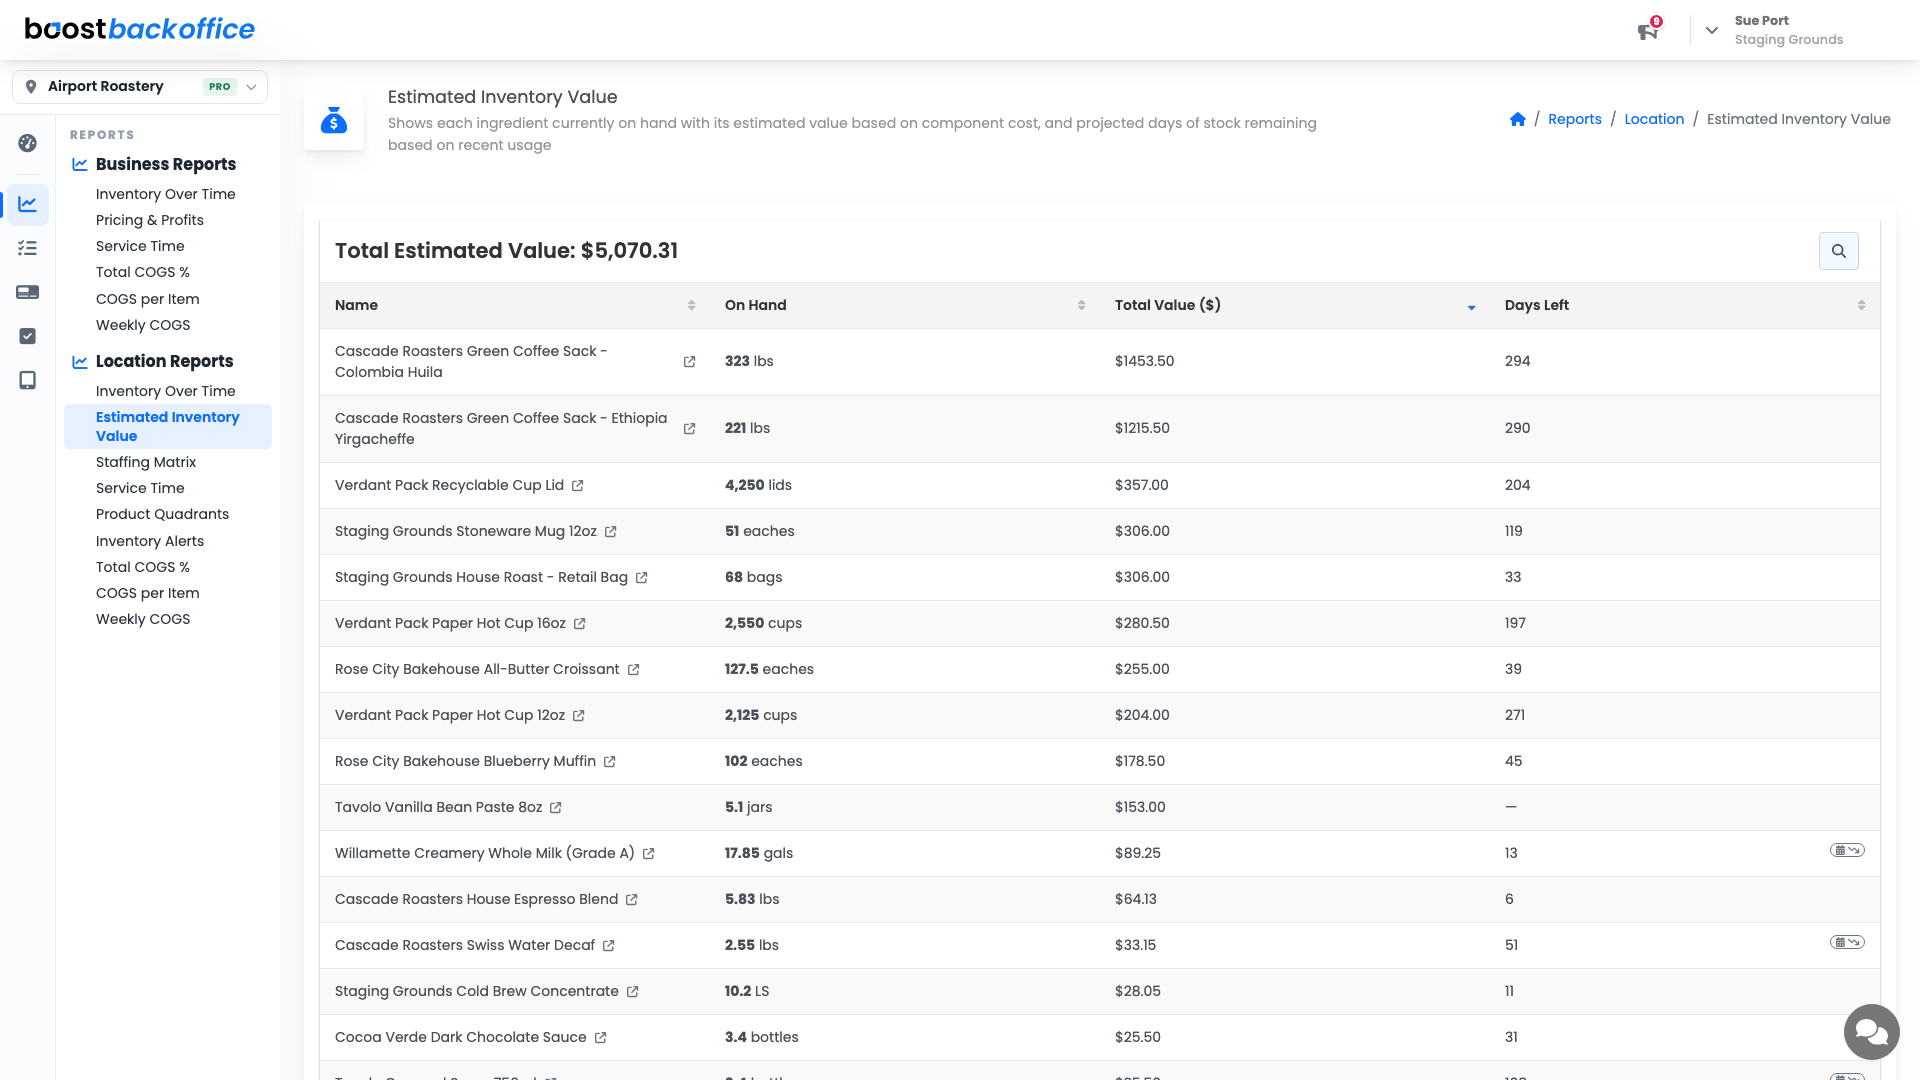
The headline is Total Estimated Value: everything this location is holding, added up. It is the number to watch when cash is tight, because inventory is cash you have already spent.
What each column tells you
| Column | What it means |
|---|---|
| On Hand | How much you have, in the unit you count it in |
| Total Value ($) | On hand valued at that ingredient's cost |
| Days Left | How long that stock lasts at recent usage |
Sorting by Total Value puts your money at the top of the page. Sorting by Days Left puts your problems there instead.
Reading it like an operator
The rows worth a second look are the ones where the two columns disagree.
- High value, high days left is money sitting still. Three hundred days of green coffee is capital on a shelf.
- Low value, low days left is tomorrow's 86. Cheap to fix today, expensive to discover mid-rush.
- No days left figure means Boost has no recent usage for it, which usually means it is not linked into a recipe yet.
Note
Values come from the cost on each ingredient's source, so this report is only as current as your prices. When a supplier raises a price, update it under Recipes & Ingredients > Ingredients > Ingredients and this report follows.
Tip
Read this the day after a full count. Between counts the value drifts with estimated usage; right after a count it is as close to the truth as your shop gets.
What you should see
A total that feels like your shop, your expensive stock at the top, and nothing sitting at a days-left figure that should worry you.
Account Level: All